
Week 4 Fantasy Football Optimizations
We are BACK with optimal lineups from week 4 simulations!
I haven’t changed the script substantially since last week, and as I went over the code for scraping projections and generating lineups last week, I’ll skip some of that this week so we can focus more on the content. If you want to review it, last week’s post is here.
Setup
library(data.table)
library(dtplyr)
library(tidyverse)
library(rPref)
library(kableExtra)

week <- 4

proj <- readRDS(paste0('week_', week, '_proj.RDS'))

sal <- read_csv('DKSalaries.csv') %>%
  rename(roster_position=`Roster Position`)

sal$Name[sal$Name=='Todd Gurley II'] <- 'Todd Gurley'
I’ll start with the optimized lineups pulled for week 4, with the same details as last time: 10,000 lineups, using the standard deviation of projections, completely individually based (still working on that).
sim_lu <- readRDS(paste0('sim_lineups_week_', week, '.RDS')) %>%
  rename(pts_base=points) %>%
  select(lineup, Name, team, position, pts_base, pts_pred, sd_pts, Salary)

glimpse(sim_lu)
## Observations: 90,000
## Variables: 8
## Groups: Name [102]
## $ lineup <int> 1, 1, 1, 1, 1, 1, 1, 1, 1, 2, 2, 2, 2, 2, 2, 2, 2, 2,...
## $ Name <chr> "Panthers", "Julian Edelman", "Chris Thompson", "Jaco...
## $ team <chr> "CAR", "NEP", "WAS", "IND", "NYG", "CAR", "LAR", "NYG...
## $ position <chr> "DST", "WR", "RB", "QB", "WR", "RB", "WR", "TE", "WR"...
## $ pts_base <dbl> 7.00000, 15.09300, 13.38127, 17.98995, 15.90300, 23.2...
## $ pts_pred <dbl> 7.473107, 18.721817, 13.805701, 20.929870, 16.615504,...
## $ sd_pts <dbl> 0.4447800, 2.0534010, 1.0393026, 1.0751164, 1.2246276...
## $ Salary <dbl> 2300, 6500, 4500, 5400, 5800, 8800, 6500, 5700, 4500,...sim_lu %>%
filter(lineup<=3) %>%
arrange(lineup, position, desc(pts_pred)) %>%
mutate_at(vars(pts_base, pts_pred, sd_pts), function(x) round(x, 2)) %>%
knitr::kable() %>%
kable_styling() %>%
column_spec(1, bold=TRUE) %>%
collapse_rows(columns = 1, valign = 'top') %>%
scroll_box(height = '500px', width = '100%')| lineup | Name | team | position | pts_base | pts_pred | sd_pts | Salary |
|---|---|---|---|---|---|---|---|
| 1 | Panthers | CAR | DST | 7.00 | 7.47 | 0.44 | 2300 |
| Jacoby Brissett | IND | QB | 17.99 | 20.93 | 1.08 | 5400 | |
| Christian McCaffrey | CAR | RB | 23.23 | 24.03 | 0.99 | 8800 | |
| Chris Thompson | WAS | RB | 13.38 | 13.81 | 1.04 | 4500 | |
| Evan Engram | NYG | TE | 16.21 | 17.01 | 2.50 | 5700 | |
| Cooper Kupp | LAR | WR | 18.02 | 19.33 | 3.62 | 6500 | |
| Julian Edelman | NEP | WR | 15.09 | 18.72 | 2.05 | 6500 | |
| Sterling Shepard | NYG | WR | 15.90 | 16.62 | 1.22 | 5800 | |
| Terry McLaurin | WAS | WR | 14.52 | 14.60 | 0.92 | 4500 | |
| 2 | Panthers | CAR | DST | 7.00 | 7.54 | 0.44 | 2300 |
| Patrick Mahomes | KCC | QB | 26.08 | 27.59 | 1.44 | 7500 | |
| Marlon Mack | IND | RB | 15.78 | 17.56 | 1.44 | 6100 | |
| Phillip Lindsay | DEN | RB | 14.72 | 16.27 | 1.28 | 5200 | |
| Kenyan Drake | MIA | RB | 11.77 | 14.50 | 1.99 | 4200 | |
| Travis Kelce | KCC | TE | 18.38 | 19.99 | 1.28 | 7200 | |
| DeAndre Hopkins | HOU | WR | 20.09 | 22.67 | 1.73 | 7700 | |
| Mecole Hardman | KCC | WR | 11.41 | 15.43 | 2.00 | 5100 | |
| Terry McLaurin | WAS | WR | 14.52 | 14.72 | 0.92 | 4500 | |
| 3 | Seahawks | SEA | DST | 8.32 | 9.41 | 0.74 | 3300 |
| Patrick Mahomes | KCC | QB | 26.08 | 26.72 | 1.44 | 7500 | |
| Austin Ekeler | LAC | RB | 21.19 | 22.45 | 0.84 | 8000 | |
| Devonta Freeman | ATL | RB | 13.20 | 15.84 | 1.66 | 5000 | |
| Kerryon Johnson | DET | RB | 15.37 | 15.34 | 0.10 | 5400 | |
| Will Dissly | SEA | TE | 9.64 | 11.05 | 1.84 | 3600 | |
| Keenan Allen | LAC | WR | 22.62 | 22.70 | 2.20 | 7600 | |
| Christian Kirk | ARI | WR | 13.64 | 15.18 | 2.43 | 5100 | |
| Terry McLaurin | WAS | WR | 14.52 | 13.70 | 0.92 | 4500 |
Who is in Optimal Lineups?
sim_lu %>%
  group_by(Name, position) %>%
  dplyr::summarize(lu=n_distinct(lineup)) %>%
  ungroup() %>%
  group_by(position) %>%
  top_n(10, lu) %>%
  ungroup() %>%
  arrange(position, desc(lu)) %>%
  mutate(Name=factor(Name),
         Name=fct_reorder(Name, lu)) %>%
  ggplot(aes(x=Name, y=lu)) +
  geom_bar(stat='identity') +
  facet_wrap(~position, ncol = 3, scales='free') +
  coord_flip() +
  scale_y_continuous(labels = scales::comma) +
  ggtitle('Top 10 Players Present by Position')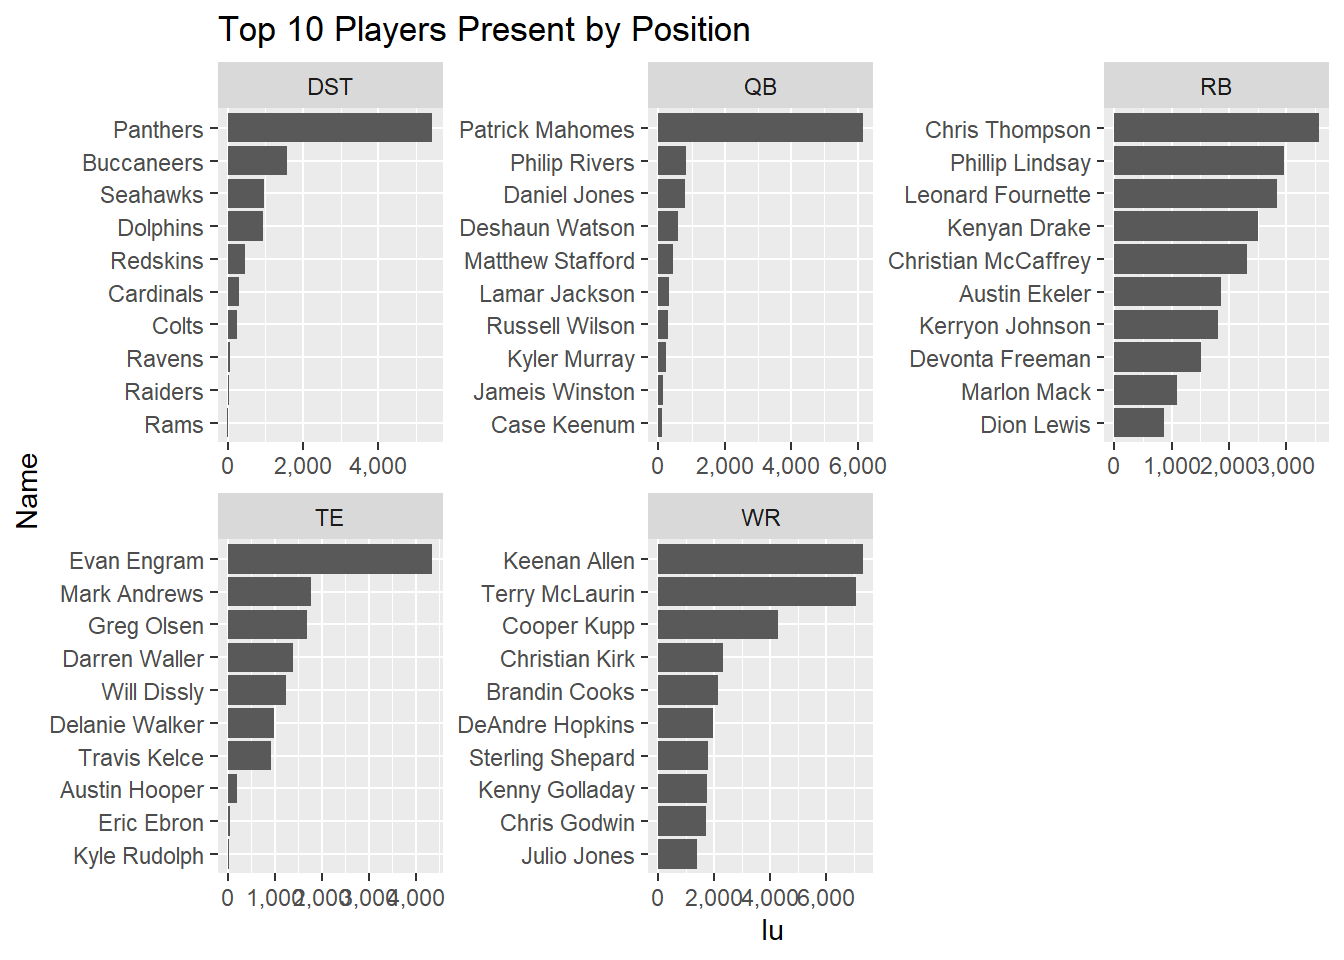
Some of my observations:
* Patrick Mahomes is HEAVILY represented here, showing up in over 6,000 lineups. No other QB shows up in more than 1,000
* There’s a fair amount of parity at RB, with a linear decline down the top 10 running backs. I guess this week, as in real life, running backs are fairly replacable.
* Keenan Allen and Terry McLaurin (and to a lesser extent, Cooper Kupp) are highly present too, which is interesting because since we can select up to 4 WRs in a lineup, you’d expect there to be a more linear decline.
* TE and D have similar patterns, there’s only 5-6 you should really consider in your lineups.
DraftKings provides scoring for 422 players this week, but only 102 make it into optimized lineups. Why is that? To determine, I’ll plot projected points vs salary, colored by whether or not they make it into optimized lineups, and sized by their projection standard deviation
plyr_lu <- sim_lu %>%
  group_by(Name, position) %>%
  dplyr::summarize(lu=n_distinct(lineup)) %>%
  ungroup()

proj %>%
  filter(avg_type=='robust') %>%
  mutate(Name = ifelse(pos=="DST", last_name, paste(first_name, last_name))) %>%
  inner_join(sal, by=c("Name")) %>%
  select(Name, team, position, points, Salary, sd_pts) %>%
  left_join(plyr_lu, by='Name') %>%
  replace_na(list(lu=0)) %>%
  mutate(lu_bin=ifelse(lu==0, '0 Lineups', '>=1 Lineups'),
         lu_5=cut(lu,5, labels = FALSE)) %>%
  ggplot(aes(x=Salary, y=points, color=lu_bin, size=sd_pts)) +
  geom_point() +
  scale_color_manual(values = c('red', 'blue'), name="") +
  geom_smooth(inherit.aes = FALSE, aes(x=Salary, y=points), method = 'lm', se=FALSE) +
  ylab('Projected Points') +
  xlab('Salary') +
  ggtitle('Who makes it into Optimized Lineups?') +
  scale_x_continuous(labels=scales::dollar)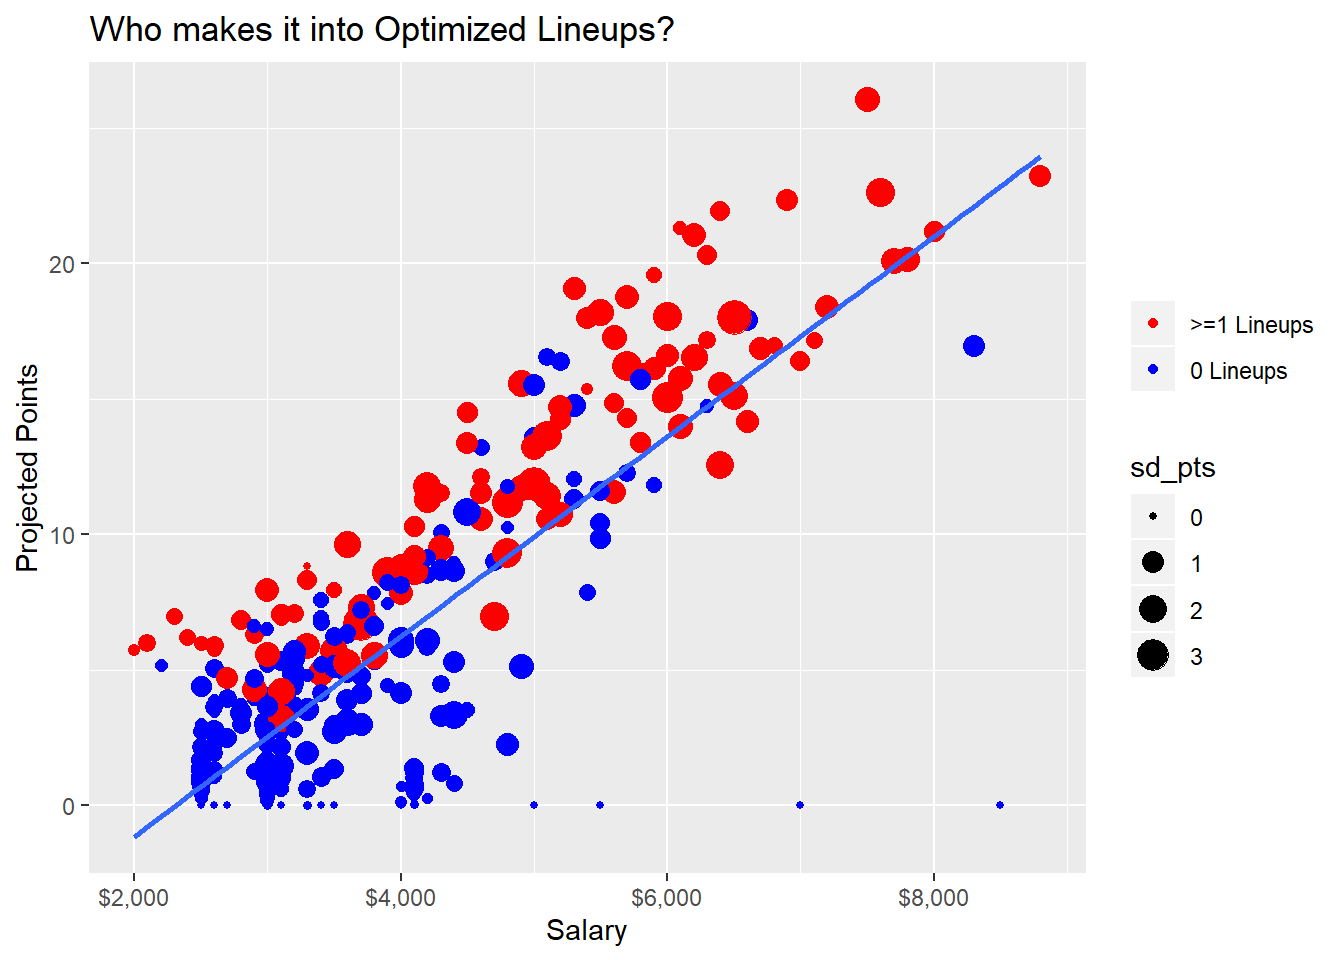
As expected, we see players with higher points per salary making it into lineups. But some above the fitted line make it and other don’t. As we can see here, it’s due to projection certainty. Players above the fitted line that make it into lineups have higher sd_pts than those who do not, meaning there’s more upside there.
Flex Configurations
In DFS lineups, you have an extra spot to use on an RB, WR, and TE of your chosing
sim_lu %>%
  group_by(lineup) %>%
  mutate(lineup_pts=sum(pts_pred)) %>%
  group_by(lineup, position) %>%
  mutate(n=n()) %>%
  select(lineup, position, n, lineup_pts) %>%
  distinct() %>%
  spread(key=position, value=n) %>%
  filter(RB>=2, TE>=1, WR>=3) %>%
  mutate(flex=case_when(RB==3 ~ 'RB',
                        TE==2 ~ 'TE',
                        WR==4 ~ 'WR')) %>%
  group_by(flex) %>%
  dplyr::summarize(pts=median(lineup_pts),
                   cases=n()) %>%
  knitr::kable() %>%
kable_styling(full_width = FALSE)| flex | pts | cases |
|---|---|---|
| RB | 156.6090 | 2404 |
| TE | 158.3351 | 2618 |
| WR | 157.8900 | 4978 |
Similar to last week, WRs are the flex selection in about half of optimal cases (4,978 this week vs 5,775 last week). Given what we saw with the last graph, this makes sense. There are some clear favorites in the WR spot that you’ll want to get, whereas RBs are fairly replaceable this week. And the situations where you want a TE in FLEX is when one really blows up, hence the higher average score.
Pareto Lineups
lu_df <- sim_lu %>%
  group_by(lineup) %>%
  dplyr::summarize(lineup_pts=sum(pts_pred),
                   lineup_sd=sum(sd_pts)) %>%
  ungroup()

pto <- psel(lu_df, low(lineup_sd) * high(lineup_pts))


ggplot(lu_df, aes(y=lineup_pts, x=lineup_sd)) +
  geom_point() +
  geom_point(data=pto, size=5) +
  ylab('Lineup Points') +
  xlab('Lineup Points St Dev') +
  ggtitle('Lineup Points vs Uncertainty',
          subtitle = 'Pareto Lineups Bolded')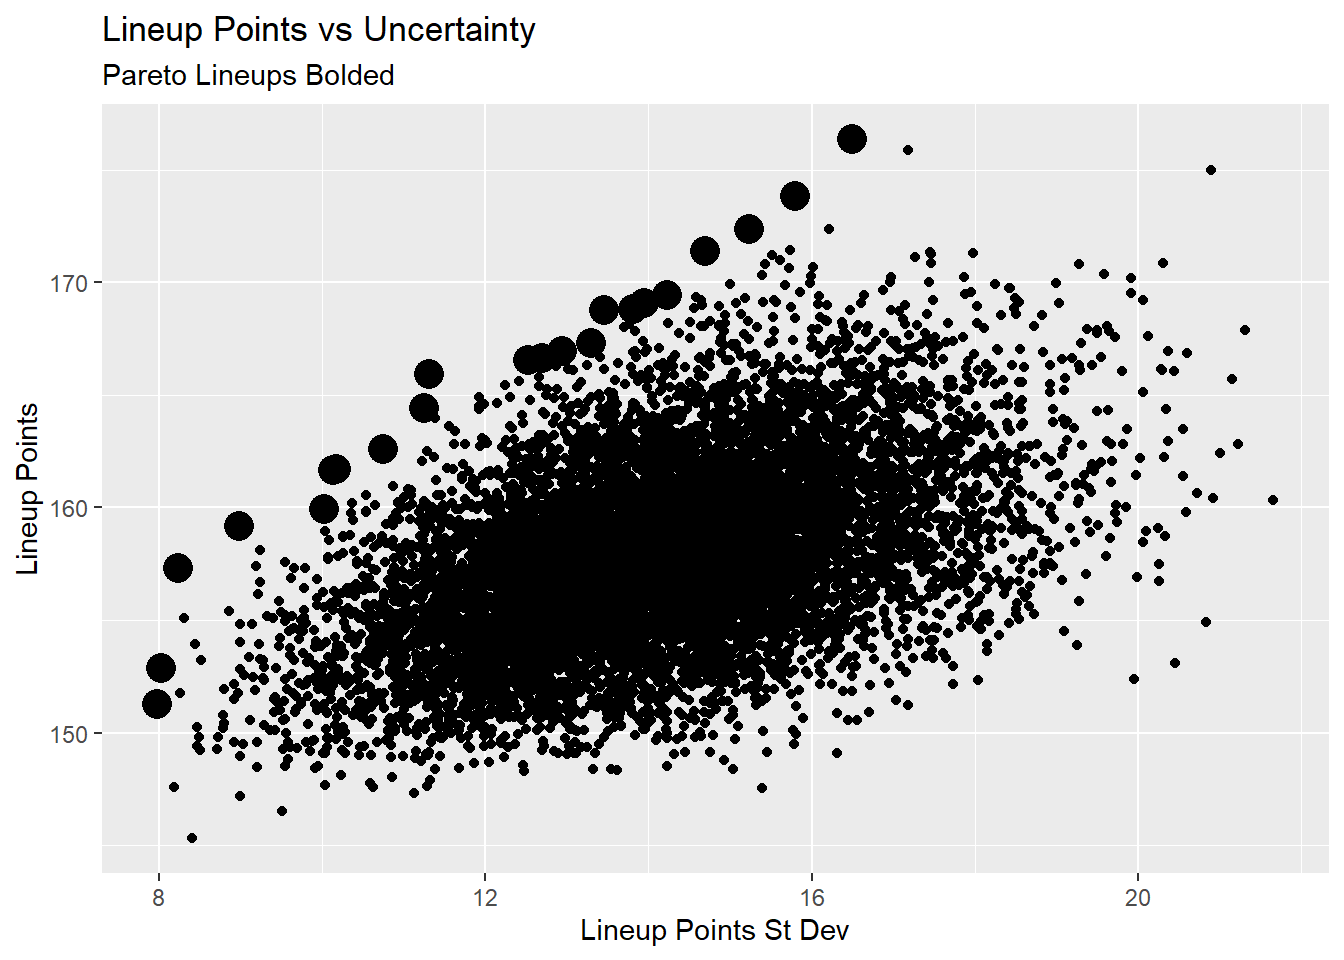
Here’s a look at the pareto lineups.
psel(lu_df, low(lineup_sd) * high(lineup_pts)) %>%
  left_join(sim_lu, by='lineup') %>%
  group_by(lineup) %>%
  arrange(lineup_pts, position, desc(pts_pred)) %>%
  select(lineup, lineup_pts, lineup_sd, Name, team, position, pts_pred, sd_pts, Salary) %>%
  mutate_at(vars(lineup_pts, lineup_sd, pts_pred, sd_pts), function(x) round(x, 2)) %>%
  knitr::kable() %>%
  kable_styling(fixed_thead = T) %>%
  column_spec(1:3, bold=TRUE) %>%
  collapse_rows(columns = 1:3, valign = 'top') %>%
scroll_box(height = '500px', width = '100%')| lineup | lineup_pts | lineup_sd | Name | team | position | pts_pred | sd_pts | Salary |
|---|---|---|---|---|---|---|---|---|
| 3554 | 151.27 | 7.98 | Panthers | CAR | DST | 7.07 | 0.44 | 2300 |
| Daniel Jones | NYG | QB | 20.79 | 1.17 | 5300 | |||
| Christian McCaffrey | CAR | RB | 25.25 | 0.99 | 8800 | |||
| Kerryon Johnson | DET | RB | 15.53 | 0.10 | 5400 | |||
| Darren Waller | OAK | TE | 14.88 | 0.90 | 5200 | |||
| Brandin Cooks | LAR | WR | 18.58 | 1.79 | 6200 | |||
| Tyler Lockett | SEA | WR | 17.50 | 0.49 | 6300 | |||
| Kenny Golladay | DET | WR | 16.85 | 1.18 | 5900 | |||
| Terry McLaurin | WAS | WR | 14.83 | 0.92 | 4500 | |||
| 4685 | 152.88 | 8.03 | Dolphins | MIA | DST | 5.77 | 0.12 | 2000 |
| Patrick Mahomes | KCC | QB | 26.18 | 1.44 | 7500 | |||
| Phillip Lindsay | DEN | RB | 15.87 | 1.28 | 5200 | |||
| Kerryon Johnson | DET | RB | 15.32 | 0.10 | 5400 | |||
| Travis Kelce | KCC | TE | 21.48 | 1.28 | 7200 | |||
| Tyler Lockett | SEA | WR | 18.54 | 0.49 | 6300 | |||
| Kenny Golladay | DET | WR | 18.07 | 1.18 | 5900 | |||
| Sterling Shepard | NYG | WR | 17.32 | 1.22 | 5800 | |||
| Terry McLaurin | WAS | WR | 14.33 | 0.92 | 4500 | |||
| 9449 | 157.31 | 8.24 | Panthers | CAR | DST | 7.19 | 0.44 | 2300 |
| Patrick Mahomes | KCC | QB | 28.55 | 1.44 | 7500 | |||
| Christian McCaffrey | CAR | RB | 24.68 | 0.99 | 8800 | |||
| Kerryon Johnson | DET | RB | 15.19 | 0.10 | 5400 | |||
| Chris Thompson | WAS | RB | 14.89 | 1.04 | 4500 | |||
| Darren Waller | OAK | TE | 14.93 | 0.90 | 5200 | |||
| Sterling Shepard | NYG | WR | 18.99 | 1.22 | 5800 | |||
| Kenny Golladay | DET | WR | 17.11 | 1.18 | 5900 | |||
| Terry McLaurin | WAS | WR | 15.78 | 0.92 | 4500 | |||
| 5294 | 159.17 | 8.98 | Panthers | CAR | DST | 7.00 | 0.44 | 2300 |
| Daniel Jones | NYG | QB | 21.49 | 1.17 | 5300 | |||
| Austin Ekeler | LAC | RB | 22.63 | 0.84 | 8000 | |||
| Kerryon Johnson | DET | RB | 15.30 | 0.10 | 5400 | |||
| Darren Waller | OAK | TE | 14.51 | 0.90 | 5200 | |||
| Keenan Allen | LAC | WR | 27.80 | 2.20 | 7600 | |||
| Kenny Golladay | DET | WR | 17.86 | 1.18 | 5900 | |||
| Sterling Shepard | NYG | WR | 17.52 | 1.22 | 5800 | |||
| Terry McLaurin | WAS | WR | 15.06 | 0.92 | 4500 | |||
| 4550 | 159.94 | 10.02 | Dolphins | MIA | DST | 5.71 | 0.12 | 2000 |
| Patrick Mahomes | KCC | QB | 28.06 | 1.44 | 7500 | |||
| Kerryon Johnson | DET | RB | 15.23 | 0.10 | 5400 | |||
| Chris Thompson | WAS | RB | 13.64 | 1.04 | 4500 | |||
| Evan Engram | NYG | TE | 18.60 | 2.50 | 5700 | |||
| Darren Waller | OAK | TE | 16.11 | 0.90 | 5200 | |||
| Keenan Allen | LAC | WR | 25.67 | 2.20 | 7600 | |||
| Tyler Lockett | SEA | WR | 18.48 | 0.49 | 6300 | |||
| Sterling Shepard | NYG | WR | 18.45 | 1.22 | 5800 | |||
| 1471 | 161.67 | 10.14 | Panthers | CAR | DST | 7.25 | 0.44 | 2300 |
| Russell Wilson | SEA | QB | 21.31 | 0.17 | 6100 | |||
| Austin Ekeler | LAC | RB | 22.67 | 0.84 | 8000 | |||
| Marlon Mack | IND | RB | 18.78 | 1.44 | 6100 | |||
| Leonard Fournette | JAC | RB | 17.46 | 1.14 | 6000 | |||
| Austin Hooper | ATL | TE | 12.55 | 0.55 | 4300 | |||
| Keenan Allen | LAC | WR | 27.97 | 2.20 | 7600 | |||
| Christian Kirk | ARI | WR | 19.30 | 2.43 | 5100 | |||
| Terry McLaurin | WAS | WR | 14.38 | 0.92 | 4500 | |||
| 3691 | 161.70 | 10.17 | Panthers | CAR | DST | 7.52 | 0.44 | 2300 |
| Patrick Mahomes | KCC | QB | 26.06 | 1.44 | 7500 | |||
| Christian McCaffrey | CAR | RB | 24.24 | 0.99 | 8800 | |||
| Kerryon Johnson | DET | RB | 15.48 | 0.10 | 5400 | |||
| Chris Thompson | WAS | RB | 14.05 | 1.04 | 4500 | |||
| Greg Olsen | CAR | TE | 16.59 | 1.93 | 4200 | |||
| Keenan Allen | LAC | WR | 27.98 | 2.20 | 7600 | |||
| Terry McLaurin | WAS | WR | 15.51 | 0.92 | 4500 | |||
| Calvin Ridley | ATL | WR | 14.27 | 1.11 | 5000 | |||
| 6859 | 162.60 | 10.75 | Panthers | CAR | DST | 7.42 | 0.44 | 2300 |
| Patrick Mahomes | KCC | QB | 27.96 | 1.44 | 7500 | |||
| Leonard Fournette | JAC | RB | 18.42 | 1.14 | 6000 | |||
| Phillip Lindsay | DEN | RB | 17.18 | 1.28 | 5200 | |||
| Chris Thompson | WAS | RB | 13.68 | 1.04 | 4500 | |||
| Austin Hooper | ATL | TE | 12.11 | 0.55 | 4300 | |||
| Keenan Allen | LAC | WR | 26.43 | 2.20 | 7600 | |||
| DeAndre Hopkins | HOU | WR | 23.27 | 1.73 | 7700 | |||
| Terry McLaurin | WAS | WR | 16.12 | 0.92 | 4500 | |||
| 707 | 164.42 | 11.25 | Panthers | CAR | DST | 7.58 | 0.44 | 2300 |
| Patrick Mahomes | KCC | QB | 29.25 | 1.44 | 7500 | |||
| Leonard Fournette | JAC | RB | 17.41 | 1.14 | 6000 | |||
| Kerryon Johnson | DET | RB | 15.39 | 0.10 | 5400 | |||
| Phillip Lindsay | DEN | RB | 14.59 | 1.28 | 5200 | |||
| Evan Engram | NYG | TE | 23.47 | 2.50 | 5700 | |||
| Keenan Allen | LAC | WR | 24.51 | 2.20 | 7600 | |||
| Sterling Shepard | NYG | WR | 17.84 | 1.22 | 5800 | |||
| Terry McLaurin | WAS | WR | 14.39 | 0.92 | 4500 | |||
| 965 | 165.93 | 11.31 | Seahawks | SEA | DST | 9.74 | 0.74 | 3300 |
| Patrick Mahomes | KCC | QB | 28.71 | 1.44 | 7500 | |||
| Leonard Fournette | JAC | RB | 17.54 | 1.14 | 6000 | |||
| Chris Thompson | WAS | RB | 14.37 | 1.04 | 4500 | |||
| Darren Waller | OAK | TE | 16.05 | 0.90 | 5200 | |||
| Keenan Allen | LAC | WR | 27.88 | 2.20 | 7600 | |||
| Christian Kirk | ARI | WR | 18.59 | 2.43 | 5100 | |||
| Tyler Lockett | SEA | WR | 17.88 | 0.49 | 6300 | |||
| Terry McLaurin | WAS | WR | 15.18 | 0.92 | 4500 | |||
| 1588 | 166.54 | 12.52 | Buccaneers | TBB | DST | 6.30 | 0.49 | 2100 |
| Russell Wilson | SEA | QB | 21.75 | 0.17 | 6100 | |||
| Phillip Lindsay | DEN | RB | 15.93 | 1.28 | 5200 | |||
| James White | NEP | RB | 14.22 | 1.38 | 4900 | |||
| Travis Kelce | KCC | TE | 20.50 | 1.28 | 7200 | |||
| Cooper Kupp | LAR | WR | 27.40 | 3.62 | 6500 | |||
| Keenan Allen | LAC | WR | 26.18 | 2.20 | 7600 | |||
| Kenny Golladay | DET | WR | 18.31 | 1.18 | 5900 | |||
| Terry McLaurin | WAS | WR | 15.95 | 0.92 | 4500 | |||
| 8679 | 166.63 | 12.70 | Cardinals | ARI | DST | 6.86 | 0.46 | 2400 |
| Patrick Mahomes | KCC | QB | 25.43 | 1.44 | 7500 | |||
| Marlon Mack | IND | RB | 18.48 | 1.44 | 6100 | |||
| Leonard Fournette | JAC | RB | 18.06 | 1.14 | 6000 | |||
| Phillip Lindsay | DEN | RB | 16.47 | 1.28 | 5200 | |||
| Delanie Walker | TEN | TE | 21.21 | 2.64 | 4800 | |||
| Keenan Allen | LAC | WR | 28.67 | 2.20 | 7600 | |||
| Kenny Golladay | DET | WR | 16.72 | 1.18 | 5900 | |||
| Terry McLaurin | WAS | WR | 14.71 | 0.92 | 4500 | |||
| 8004 | 166.94 | 12.94 | Panthers | CAR | DST | 7.52 | 0.44 | 2300 |
| Daniel Jones | NYG | QB | 21.26 | 1.17 | 5300 | |||
| Leonard Fournette | JAC | RB | 18.83 | 1.14 | 6000 | |||
| Phillip Lindsay | DEN | RB | 16.23 | 1.28 | 5200 | |||
| Travis Kelce | KCC | TE | 20.93 | 1.28 | 7200 | |||
| Darren Waller | OAK | TE | 15.30 | 0.90 | 5200 | |||
| Cooper Kupp | LAR | WR | 28.81 | 3.62 | 6500 | |||
| Keenan Allen | LAC | WR | 22.79 | 2.20 | 7600 | |||
| Terry McLaurin | WAS | WR | 15.28 | 0.92 | 4500 | |||
| 7319 | 167.30 | 13.29 | Colts | IND | DST | 7.99 | 0.89 | 3100 |
| Deshaun Watson | HOU | QB | 22.05 | 0.71 | 6400 | |||
| Austin Ekeler | LAC | RB | 21.28 | 0.84 | 8000 | |||
| Chris Thompson | WAS | RB | 14.20 | 1.04 | 4500 | |||
| Will Dissly | SEA | TE | 14.74 | 1.84 | 3600 | |||
| Keenan Allen | LAC | WR | 29.72 | 2.20 | 7600 | |||
| Cooper Kupp | LAR | WR | 23.45 | 3.62 | 6500 | |||
| Sterling Shepard | NYG | WR | 19.53 | 1.22 | 5800 | |||
| Terry McLaurin | WAS | WR | 14.35 | 0.92 | 4500 | |||
| 3961 | 168.77 | 13.45 | Panthers | CAR | DST | 7.07 | 0.44 | 2300 |
| Patrick Mahomes | KCC | QB | 29.87 | 1.44 | 7500 | |||
| Kerryon Johnson | DET | RB | 15.37 | 0.10 | 5400 | |||
| Chris Thompson | WAS | RB | 13.67 | 1.04 | 4500 | |||
| Evan Engram | NYG | TE | 18.10 | 2.50 | 5700 | |||
| Cooper Kupp | LAR | WR | 28.80 | 3.62 | 6500 | |||
| Keenan Allen | LAC | WR | 22.91 | 2.20 | 7600 | |||
| Kenny Golladay | DET | WR | 18.72 | 1.18 | 5900 | |||
| Terry McLaurin | WAS | WR | 14.26 | 0.92 | 4500 | |||
| 5829 | 168.82 | 13.81 | Panthers | CAR | DST | 6.80 | 0.44 | 2300 |
| Patrick Mahomes | KCC | QB | 27.41 | 1.44 | 7500 | |||
| Austin Ekeler | LAC | RB | 23.07 | 0.84 | 8000 | |||
| James White | NEP | RB | 14.47 | 1.38 | 4900 | |||
| Chris Thompson | WAS | RB | 13.61 | 1.04 | 4500 | |||
| Greg Olsen | CAR | TE | 16.02 | 1.93 | 4200 | |||
| Keenan Allen | LAC | WR | 28.19 | 2.20 | 7600 | |||
| Cooper Kupp | LAR | WR | 22.78 | 3.62 | 6500 | |||
| Terry McLaurin | WAS | WR | 16.48 | 0.92 | 4500 | |||
| 5723 | 169.07 | 13.94 | Buccaneers | TBB | DST | 6.92 | 0.49 | 2100 |
| Patrick Mahomes | KCC | QB | 25.19 | 1.44 | 7500 | |||
| Christian McCaffrey | CAR | RB | 23.63 | 0.99 | 8800 | |||
| Chris Thompson | WAS | RB | 14.15 | 1.04 | 4500 | |||
| Evan Engram | NYG | TE | 20.53 | 2.50 | 5700 | |||
| Greg Olsen | CAR | TE | 16.39 | 1.93 | 4200 | |||
| Keenan Allen | LAC | WR | 26.27 | 2.20 | 7600 | |||
| Christian Kirk | ARI | WR | 19.56 | 2.43 | 5100 | |||
| Terry McLaurin | WAS | WR | 16.43 | 0.92 | 4500 | |||
| 3067 | 169.44 | 14.23 | Panthers | CAR | DST | 7.10 | 0.44 | 2300 |
| Patrick Mahomes | KCC | QB | 25.99 | 1.44 | 7500 | |||
| Christian McCaffrey | CAR | RB | 23.35 | 0.99 | 8800 | |||
| Phillip Lindsay | DEN | RB | 18.11 | 1.28 | 5200 | |||
| Greg Olsen | CAR | TE | 13.78 | 1.93 | 4200 | |||
| Cooper Kupp | LAR | WR | 28.41 | 3.62 | 6500 | |||
| Christian Kirk | ARI | WR | 18.81 | 2.43 | 5100 | |||
| Kenny Golladay | DET | WR | 18.27 | 1.18 | 5900 | |||
| Terry McLaurin | WAS | WR | 15.61 | 0.92 | 4500 | |||
| 7807 | 171.38 | 14.70 | Cardinals | ARI | DST | 6.86 | 0.46 | 2400 |
| Patrick Mahomes | KCC | QB | 29.70 | 1.44 | 7500 | |||
| Austin Ekeler | LAC | RB | 22.46 | 0.84 | 8000 | |||
| Kerryon Johnson | DET | RB | 15.28 | 0.10 | 5400 | |||
| Evan Engram | NYG | TE | 22.42 | 2.50 | 5700 | |||
| Mark Andrews | BAL | TE | 19.40 | 3.51 | 5000 | |||
| Keenan Allen | LAC | WR | 26.79 | 2.20 | 7600 | |||
| Terry McLaurin | WAS | WR | 15.42 | 0.92 | 4500 | |||
| Danny Amendola | DET | WR | 13.03 | 2.73 | 3900 | |||
| 4114 | 172.36 | 15.23 | Panthers | CAR | DST | 7.18 | 0.44 | 2300 |
| Patrick Mahomes | KCC | QB | 26.41 | 1.44 | 7500 | |||
| Phillip Lindsay | DEN | RB | 15.85 | 1.28 | 5200 | |||
| Chris Thompson | WAS | RB | 14.10 | 1.04 | 4500 | |||
| Evan Engram | NYG | TE | 22.67 | 2.50 | 5700 | |||
| Keenan Allen | LAC | WR | 28.65 | 2.20 | 7600 | |||
| Cooper Kupp | LAR | WR | 22.50 | 3.62 | 6500 | |||
| Brandin Cooks | LAR | WR | 18.84 | 1.79 | 6200 | |||
| Terry McLaurin | WAS | WR | 16.17 | 0.92 | 4500 | |||
| 7343 | 173.85 | 15.80 | Panthers | CAR | DST | 6.59 | 0.44 | 2300 |
| Patrick Mahomes | KCC | QB | 29.57 | 1.44 | 7500 | |||
| Austin Ekeler | LAC | RB | 21.32 | 0.84 | 8000 | |||
| Kenyan Drake | MIA | RB | 15.87 | 1.99 | 4200 | |||
| Evan Engram | NYG | TE | 19.47 | 2.50 | 5700 | |||
| Will Dissly | SEA | TE | 14.34 | 1.84 | 3600 | |||
| Keenan Allen | LAC | WR | 25.98 | 2.20 | 7600 | |||
| Cooper Kupp | LAR | WR | 24.72 | 3.62 | 6500 | |||
| Terry McLaurin | WAS | WR | 15.99 | 0.92 | 4500 | |||
| 2222 | 176.35 | 16.50 | Panthers | CAR | DST | 7.16 | 0.44 | 2300 |
| Matthew Stafford | DET | QB | 21.47 | 1.84 | 5500 | |||
| Christian McCaffrey | CAR | RB | 25.58 | 0.99 | 8800 | |||
| Leonard Fournette | JAC | RB | 18.85 | 1.14 | 6000 | |||
| Mark Andrews | BAL | TE | 21.14 | 3.51 | 5000 | |||
| Will Dissly | SEA | TE | 13.06 | 1.84 | 3600 | |||
| Cooper Kupp | LAR | WR | 28.72 | 3.62 | 6500 | |||
| Keenan Allen | LAC | WR | 24.49 | 2.20 | 7600 | |||
| Terry McLaurin | WAS | WR | 15.88 | 0.92 | 4500 |
Full optimized lineups are located here
