
Week 6 Fantasy Football Optimizations
We are BACK with optimal lineups from week 6 simulations!
Again, no real changes since last week. If you want to review the overall code for scraping and optimizing projections, the initial post is here.
Setup
library(data.table)
library(dtplyr)
library(tidyverse)
library(rPref)
library(kableExtra)

week <- 6

proj <- readRDS(paste0('week_', week, '_proj.RDS'))

sal <- read_csv(paste0('DKSalaries_wk_', week, '.csv'))
I’ll start with the optimized lineups pulled for week 4, with the same details as last time: 10,000 lineups, using the standard deviation of projections, completely individually based (still working on that).
sim_lu <- readRDS(paste0('sim_lineups_week_', week, '.RDS')) %>%
  rename(pts_base=points) %>%
  select(lineup, Name, team, position, pts_base, pts_pred, sd_pts, Salary)

glimpse(sim_lu)
## Observations: 90,000
## Variables: 8
## Groups: Name [134]
## $ lineup <int> 1, 1, 1, 1, 1, 1, 1, 1, 1, 2, 2, 2, 2, 2, 2, 2, 2, 2,...
## $ Name <chr> "Jets", "Julio Jones", "Robert Woods", "Kenyan Drake"...
## $ team <chr> "NYJ", "ATL", "LAR", "MIA", "CLE", "NOS", "LAR", "BAL...
## $ position <chr> "DST", "WR", "WR", "RB", "WR", "RB", "WR", "QB", "TE"...
## $ pts_base <dbl> 6.074374, 19.892882, 15.482340, 12.329817, 6.553271, ...
## $ pts_pred <dbl> 6.158088, 23.390689, 16.572083, 14.064840, 12.617719,...
## $ sd_pts <dbl> 0.9960531, 1.1954801, 1.0171230, 1.5419781, 2.7852936...
## $ Salary <dbl> 1500, 8000, 5600, 4400, 3700, 8000, 7100, 6900, 4800,...sim_lu %>%
filter(lineup<=3) %>%
arrange(lineup, position, desc(pts_pred)) %>%
mutate_at(vars(pts_base, pts_pred, sd_pts), function(x) round(x, 2)) %>%
knitr::kable() %>%
kable_styling() %>%
column_spec(1, bold=TRUE) %>%
collapse_rows(columns = 1, valign = 'top') %>%
scroll_box(height = '600px', width = '100%')| lineup | Name | team | position | pts_base | pts_pred | sd_pts | Salary |
|---|---|---|---|---|---|---|---|
| 1 | Jets | NYJ | DST | 6.07 | 6.16 | 1.00 | 1500 |
| Lamar Jackson | BAL | QB | 24.28 | 25.77 | 1.41 | 6900 | |
| Alvin Kamara | NOS | RB | 20.54 | 20.91 | 0.37 | 8000 | |
| Kenyan Drake | MIA | RB | 12.33 | 14.06 | 1.54 | 4400 | |
| Mark Andrews | BAL | TE | 12.27 | 18.02 | 2.55 | 4800 | |
| Julio Jones | ATL | WR | 19.89 | 23.39 | 1.20 | 8000 | |
| Cooper Kupp | LAR | WR | 19.75 | 20.88 | 1.08 | 7100 | |
| Robert Woods | LAR | WR | 15.48 | 16.57 | 1.02 | 5600 | |
| Rashard Higgins | CLE | WR | 6.55 | 12.62 | 2.79 | 3700 | |
| 2 | Jets | NYJ | DST | 6.07 | 7.23 | 1.00 | 1500 |
| Deshaun Watson | HOU | QB | 22.52 | 22.93 | 1.43 | 6700 | |
| Nick Chubb | CLE | RB | 18.54 | 19.42 | 1.94 | 7300 | |
| Todd Gurley | LAR | RB | 16.57 | 18.90 | 1.70 | 6200 | |
| Le’Veon Bell | NYJ | RB | 18.56 | 18.82 | 1.20 | 6400 | |
| Chris Herndon | NYJ | TE | 6.49 | 11.13 | 1.25 | 3500 | |
| Cooper Kupp | LAR | WR | 19.75 | 20.03 | 1.08 | 7100 | |
| Larry Fitzgerald | ARI | WR | 15.64 | 17.56 | 2.26 | 6100 | |
| Jarvis Landry | CLE | WR | 12.55 | 16.51 | 1.88 | 5200 | |
| 3 | Jets | NYJ | DST | 6.07 | 5.89 | 1.00 | 1500 |
| Patrick Mahomes | KCC | QB | 24.29 | 26.53 | 2.39 | 7500 | |
| Dalvin Cook | MIN | RB | 20.13 | 23.33 | 2.51 | 8400 | |
| Adrian Peterson | WAS | RB | 10.00 | 13.34 | 1.77 | 4500 | |
| Ricky Seals-Jones | CLE | TE | 7.04 | 9.20 | 1.24 | 3300 | |
| Cooper Kupp | LAR | WR | 19.75 | 21.24 | 1.08 | 7100 | |
| Amari Cooper | DAL | WR | 18.27 | 20.14 | 1.74 | 7000 | |
| Larry Fitzgerald | ARI | WR | 15.64 | 17.72 | 2.26 | 6100 | |
| Mohamed Sanu | ATL | WR | 12.64 | 13.04 | 0.52 | 4500 |
Who is in Optimal Lineups?
sim_lu %>%
  group_by(Name, position, Salary) %>%
  dplyr::summarize(lu=n_distinct(lineup)) %>%
  ungroup() %>%
  group_by(position) %>%
  top_n(10, lu) %>%
  ungroup() %>%
  arrange(position, desc(lu)) %>%
  mutate(Name=factor(Name),
         Name=fct_reorder(Name, lu)) %>%
  ggplot(aes(x=Name, y=lu/1000, fill=Salary)) +
  geom_bar(stat='identity') +
  facet_wrap(~position, ncol = 3, scales='free') +
  coord_flip() +
  scale_y_continuous(labels = scales::comma) +
  scale_fill_viridis_c() +
  xlab('') +
  ylab('Lineups (Thousands)') +
ggtitle('Top 10 Players Present by Position') 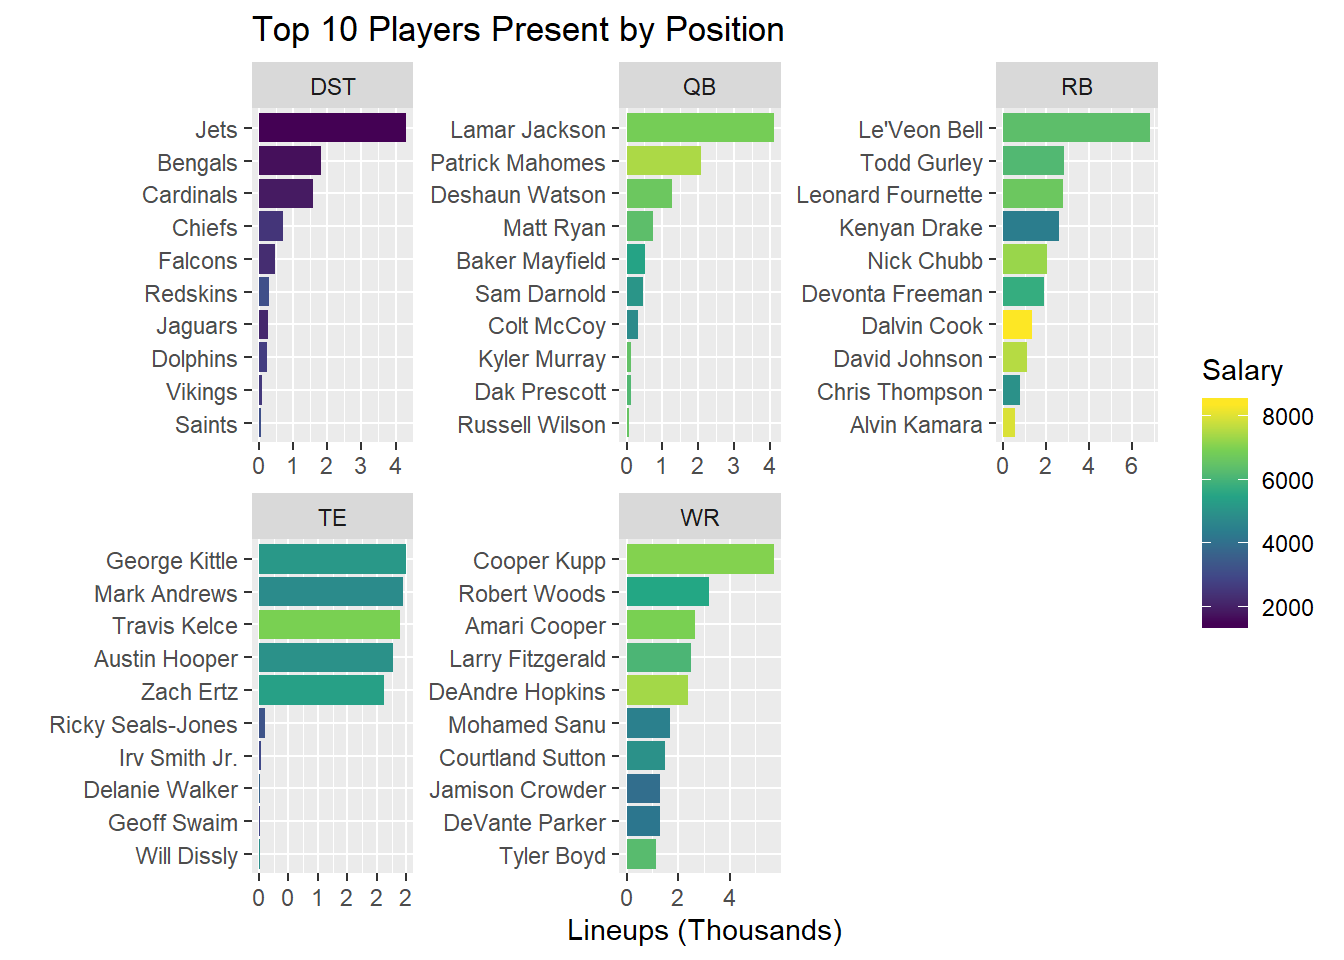
Some of my observations:
More favorites this week at QB, with Lamar Jackson being in almost 40% of lineups. Patrick Mahomes comes in next at around 20%. DeShaun Watson is the only other QB in at least 10% of lineups.
Le’Veon Bell is a heavy favorite at RB, showing up in almost 60% of lineups. Kenyan Drake appears to be the value play.
Cooper Kupp is the biggest play at WR, with Robert Woods in 2nd (which I resent as a Niners fan). Sanu, Sutton, Crowder, and Parker are all value plays, at relatively low salaries
It’s the usual suspects at TE, with Kelce being the only one you potentially have to pay up for.
Jets are a strong favorite at D this week, most likely due to their price. Over the last few weeks, the model has selected the D with the lowest price.
Who is getting placed in Lineups?
DraftKings provides scoring for 347 players this week, but only 134 make it into optimized lineups. Why is that? To determine, I’ll plot projected points vs salary, colored by whether or not they make it into optimized lineups, and sized by their projection standard deviation
plyr_lu <- sim_lu %>%
  group_by(Name, position) %>%
  dplyr::summarize(lu=n_distinct(lineup)) %>%
  ungroup()

proj %>%
  filter(avg_type=='weighted') %>%
  mutate(Name = ifelse(pos=="DST", last_name, paste(first_name, last_name))) %>%
  inner_join(sal, by=c("Name")) %>%
  select(Name, team, position, points, Salary, sd_pts) %>%
  left_join(plyr_lu, by='Name') %>%
  replace_na(list(lu=0)) %>%
  mutate(lu_bin=ifelse(lu==0, '0 Lineups', '>=1 Lineups'),
         lu_5=cut(lu,5, labels = FALSE)) %>%
  ggplot(aes(x=Salary, y=points, color=lu_bin, size=sd_pts)) +
  geom_point() +
  scale_color_manual(values = c('red', 'blue'), name="") +
  geom_smooth(inherit.aes = FALSE, aes(x=Salary, y=points), method = 'lm', se=FALSE) +
  ylab('Projected Points') +
  xlab('Salary') +
  ggtitle('Who makes it into Optimized Lineups?') +
  scale_x_continuous(labels=scales::dollar)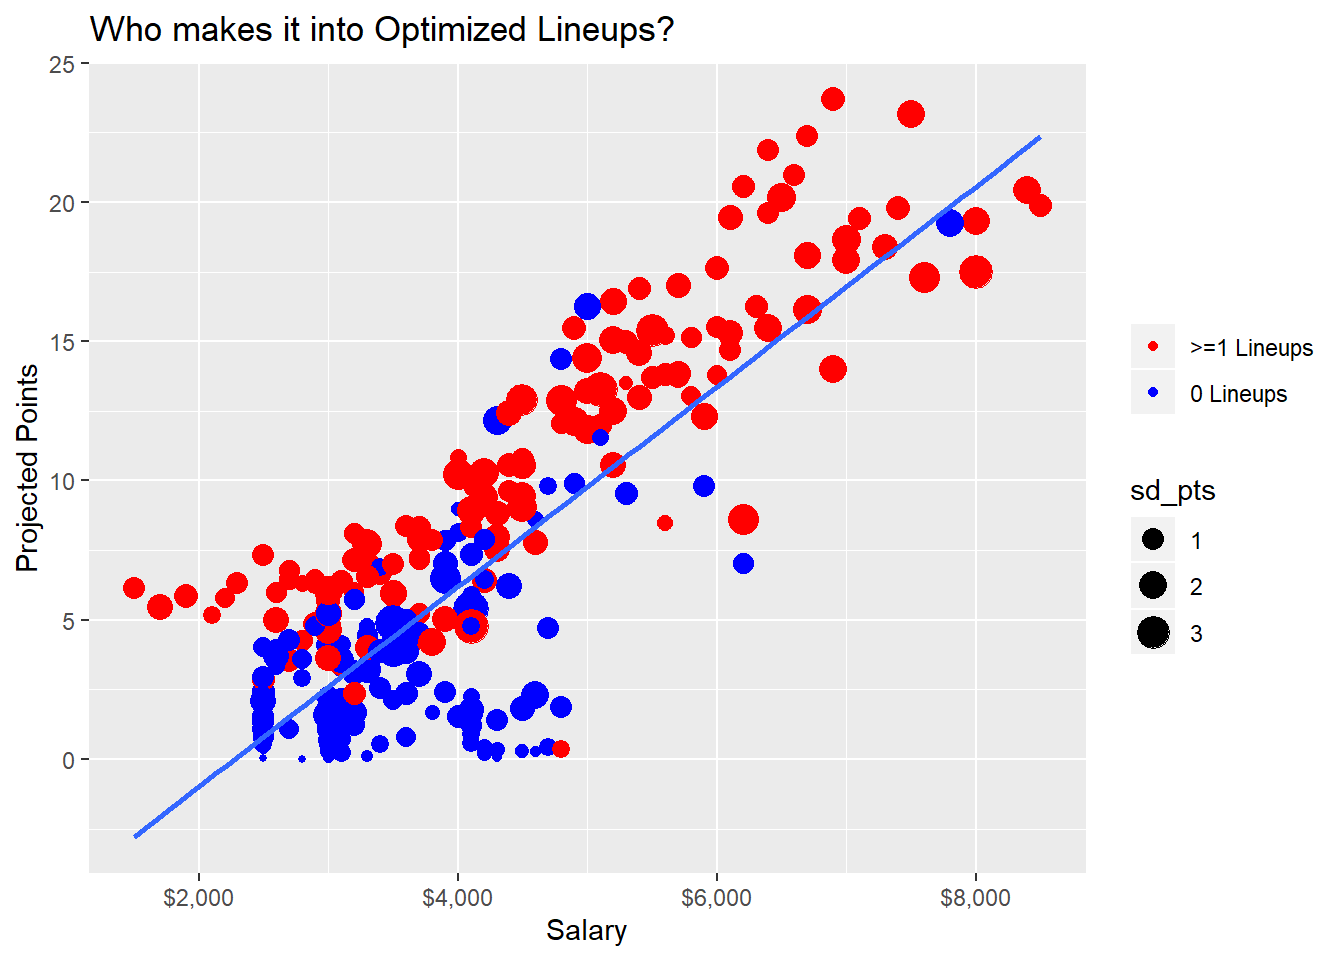
Interestingly, we see some players below the fitted line make it into optimal lineups, but we can see that these are due to high player uncertainty, so these are players with high potential to blow up, even though their average prediction is fairly low.
Flex Configurations
In DFS lineups, you have an extra spot to use on an RB, WR, and TE of your chosing
sim_lu %>%
  group_by(lineup) %>%
  mutate(lineup_pts=sum(pts_pred)) %>%
  group_by(lineup, position) %>%
  mutate(n=n()) %>%
  select(lineup, position, n, lineup_pts) %>%
  distinct() %>%
  spread(key=position, value=n) %>%
  filter(RB>=2, TE>=1, WR>=3) %>%
  mutate(flex=case_when(RB==3 ~ 'RB',
                        TE==2 ~ 'TE',
                        WR==4 ~ 'WR')) %>%
  group_by(flex) %>%
  dplyr::summarize(pts=median(lineup_pts),
                   cases=n()) %>%
  knitr::kable() %>%
kable_styling(full_width = FALSE)| flex | pts | cases |
|---|---|---|
| RB | 154.6084 | 4569 |
| TE | 154.7718 | 1955 |
| WR | 154.4508 | 3476 |
In contrast to previous weeks, where WRs were the most popular optimal configuration, RB’s are the most popular this week, taking the flex spot in 45% of lineups!
Pareto Lineups
lu_df <- sim_lu %>%
  group_by(lineup) %>%
  dplyr::summarize(lineup_pts=sum(pts_pred),
                   lineup_sd=sum(sd_pts)) %>%
  ungroup()

pto <- psel(lu_df, low(lineup_sd) * high(lineup_pts))


ggplot(lu_df, aes(y=lineup_pts, x=lineup_sd)) +
  geom_point() +
  geom_point(data=pto, size=5) +
  ylab('Lineup Points') +
  xlab('Lineup Points St Dev') +
  ggtitle('Lineup Points vs Uncertainty',
          subtitle = 'Pareto Lineups Bolded')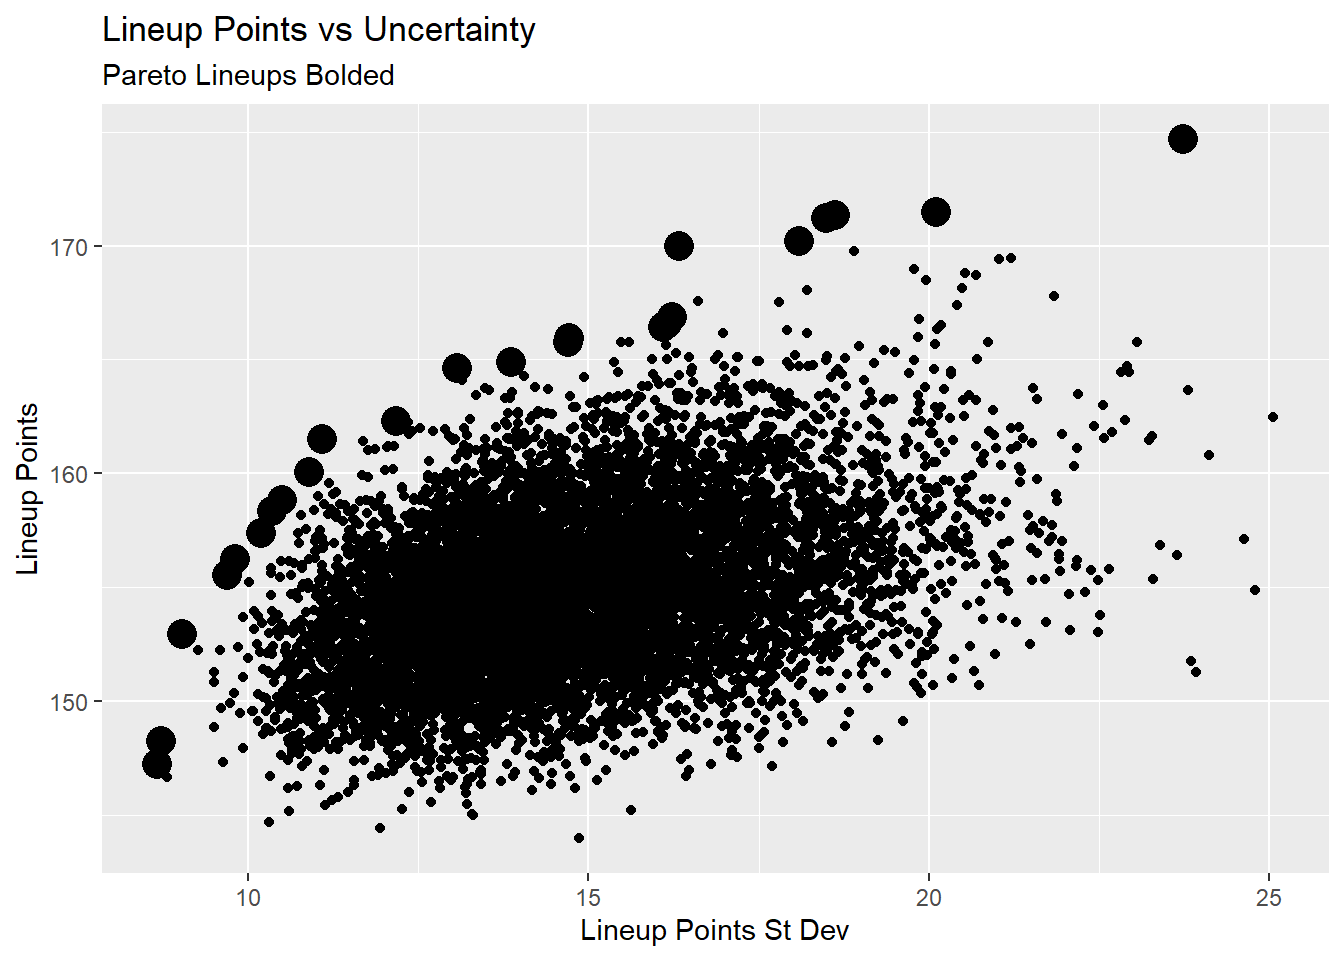
Here’s a look at the pareto lineups.
psel(lu_df, low(lineup_sd) * high(lineup_pts)) %>%
  left_join(sim_lu, by='lineup') %>%
  group_by(lineup) %>%
  arrange(lineup_pts, position, desc(pts_pred)) %>%
  select(lineup, lineup_pts, lineup_sd, Name, team, position, pts_pred, sd_pts, Salary) %>%
  mutate_at(vars(lineup_pts, lineup_sd, pts_pred, sd_pts), function(x) round(x, 2)) %>%
  knitr::kable() %>%
  kable_styling(fixed_thead = T) %>%
  column_spec(1:3, bold=TRUE) %>%
  collapse_rows(columns = 1:3, valign = 'top') %>%
scroll_box(height = '500px', width = '100%')| lineup | lineup_pts | lineup_sd | Name | team | position | pts_pred | sd_pts | Salary |
|---|---|---|---|---|---|---|---|---|
| 8946 | 147.23 | 8.66 | Dolphins | MIA | DST | 9.14 | 0.87 | 2700 |
| Dak Prescott | DAL | QB | 22.86 | 0.97 | 6200 | |||
| Devonta Freeman | ATL | RB | 16.83 | 0.98 | 5800 | |||
| Joe Mixon | CIN | RB | 14.64 | 1.18 | 5500 | |||
| George Kittle | SFO | TE | 15.01 | 0.93 | 5200 | |||
| DeAndre Hopkins | HOU | WR | 19.56 | 1.12 | 7400 | |||
| Cooper Kupp | LAR | WR | 19.45 | 1.08 | 7100 | |||
| Robert Woods | LAR | WR | 16.55 | 1.02 | 5600 | |||
| Mohamed Sanu | ATL | WR | 13.18 | 0.52 | 4500 | |||
| 8678 | 148.25 | 8.71 | Chiefs | KCC | DST | 8.97 | 0.95 | 2500 |
| Dak Prescott | DAL | QB | 22.90 | 0.97 | 6200 | |||
| Alvin Kamara | NOS | RB | 21.18 | 0.37 | 8000 | |||
| Le’Veon Bell | NYJ | RB | 18.88 | 1.20 | 6400 | |||
| George Kittle | SFO | TE | 15.36 | 0.93 | 5200 | |||
| Austin Hooper | ATL | TE | 14.74 | 1.49 | 5000 | |||
| Cooper Kupp | LAR | WR | 19.04 | 1.08 | 7100 | |||
| Courtland Sutton | DEN | WR | 14.56 | 1.21 | 5000 | |||
| Mohamed Sanu | ATL | WR | 12.64 | 0.52 | 4500 | |||
| 2729 | 152.94 | 9.03 | Falcons | ATL | DST | 9.18 | 1.03 | 2300 |
| Lamar Jackson | BAL | QB | 25.60 | 1.41 | 6900 | |||
| Alvin Kamara | NOS | RB | 20.48 | 0.37 | 8000 | |||
| Devonta Freeman | ATL | RB | 16.65 | 0.98 | 5800 | |||
| George Kittle | SFO | TE | 15.72 | 0.93 | 5200 | |||
| Austin Hooper | ATL | TE | 15.25 | 1.49 | 5000 | |||
| Cooper Kupp | LAR | WR | 21.15 | 1.08 | 7100 | |||
| Courtland Sutton | DEN | WR | 15.57 | 1.21 | 5000 | |||
| Mohamed Sanu | ATL | WR | 13.34 | 0.52 | 4500 | |||
| 6916 | 155.54 | 9.69 | Jets | NYJ | DST | 7.47 | 1.00 | 1500 |
| Lamar Jackson | BAL | QB | 27.70 | 1.41 | 6900 | |||
| Alvin Kamara | NOS | RB | 20.93 | 0.37 | 8000 | |||
| Le’Veon Bell | NYJ | RB | 20.85 | 1.20 | 6400 | |||
| Devonta Freeman | ATL | RB | 15.96 | 0.98 | 5800 | |||
| George Kittle | SFO | TE | 14.57 | 0.93 | 5200 | |||
| Larry Fitzgerald | ARI | WR | 18.50 | 2.26 | 6100 | |||
| Robert Woods | LAR | WR | 16.46 | 1.02 | 5600 | |||
| Mohamed Sanu | ATL | WR | 13.09 | 0.52 | 4500 | |||
| 6670 | 156.23 | 9.81 | Jets | NYJ | DST | 7.43 | 1.00 | 1500 |
| Deshaun Watson | HOU | QB | 23.75 | 1.43 | 6700 | |||
| Alvin Kamara | NOS | RB | 21.22 | 0.37 | 8000 | |||
| Le’Veon Bell | NYJ | RB | 19.99 | 1.20 | 6400 | |||
| Zach Ertz | PHI | TE | 16.72 | 1.40 | 5400 | |||
| George Kittle | SFO | TE | 15.53 | 0.93 | 5200 | |||
| Cooper Kupp | LAR | WR | 21.27 | 1.08 | 7100 | |||
| Jarvis Landry | CLE | WR | 17.04 | 1.88 | 5200 | |||
| Mohamed Sanu | ATL | WR | 13.28 | 0.52 | 4500 | |||
| 7592 | 157.37 | 10.18 | Jets | NYJ | DST | 6.74 | 1.00 | 1500 |
| Lamar Jackson | BAL | QB | 25.18 | 1.41 | 6900 | |||
| Alvin Kamara | NOS | RB | 21.55 | 0.37 | 8000 | |||
| Devonta Freeman | ATL | RB | 17.01 | 0.98 | 5800 | |||
| Kenyan Drake | MIA | RB | 16.47 | 1.54 | 4400 | |||
| Zach Ertz | PHI | TE | 17.51 | 1.40 | 5400 | |||
| Cooper Kupp | LAR | WR | 19.78 | 1.08 | 7100 | |||
| Tyler Lockett | SEA | WR | 19.63 | 1.87 | 6400 | |||
| Mohamed Sanu | ATL | WR | 13.48 | 0.52 | 4500 | |||
| 2709 | 158.33 | 10.34 | Chiefs | KCC | DST | 8.11 | 0.95 | 2500 |
| Lamar Jackson | BAL | QB | 28.06 | 1.41 | 6900 | |||
| Le’Veon Bell | NYJ | RB | 20.40 | 1.20 | 6400 | |||
| Todd Gurley | LAR | RB | 19.71 | 1.70 | 6200 | |||
| Devonta Freeman | ATL | RB | 18.32 | 0.98 | 5800 | |||
| Austin Hooper | ATL | TE | 15.33 | 1.49 | 5000 | |||
| Cooper Kupp | LAR | WR | 19.74 | 1.08 | 7100 | |||
| Robert Woods | LAR | WR | 14.90 | 1.02 | 5600 | |||
| Mohamed Sanu | ATL | WR | 13.75 | 0.52 | 4500 | |||
| 2826 | 158.85 | 10.49 | Jets | NYJ | DST | 7.43 | 1.00 | 1500 |
| Lamar Jackson | BAL | QB | 26.85 | 1.41 | 6900 | |||
| Todd Gurley | LAR | RB | 21.48 | 1.70 | 6200 | |||
| Le’Veon Bell | NYJ | RB | 19.81 | 1.20 | 6400 | |||
| Kenyan Drake | MIA | RB | 14.00 | 1.54 | 4400 | |||
| George Kittle | SFO | TE | 14.90 | 0.93 | 5200 | |||
| DeAndre Hopkins | HOU | WR | 20.83 | 1.12 | 7400 | |||
| Cooper Kupp | LAR | WR | 20.41 | 1.08 | 7100 | |||
| Mohamed Sanu | ATL | WR | 13.13 | 0.52 | 4500 | |||
| 9973 | 160.06 | 10.89 | Cardinals | ARI | DST | 9.77 | 1.37 | 1900 |
| Deshaun Watson | HOU | QB | 26.89 | 1.43 | 6700 | |||
| Le’Veon Bell | NYJ | RB | 18.80 | 1.20 | 6400 | |||
| Todd Gurley | LAR | RB | 18.62 | 1.70 | 6200 | |||
| Kenyan Drake | MIA | RB | 16.94 | 1.54 | 4400 | |||
| George Kittle | SFO | TE | 14.99 | 0.93 | 5200 | |||
| Cooper Kupp | LAR | WR | 21.52 | 1.08 | 7100 | |||
| DeAndre Hopkins | HOU | WR | 20.17 | 1.12 | 7400 | |||
| Mohamed Sanu | ATL | WR | 12.37 | 0.52 | 4500 | |||
| 8081 | 161.51 | 11.08 | Jets | NYJ | DST | 8.57 | 1.00 | 1500 |
| Lamar Jackson | BAL | QB | 25.95 | 1.41 | 6900 | |||
| Le’Veon Bell | NYJ | RB | 19.62 | 1.20 | 6400 | |||
| Devonta Freeman | ATL | RB | 17.02 | 0.98 | 5800 | |||
| Zach Ertz | PHI | TE | 17.85 | 1.40 | 5400 | |||
| George Kittle | SFO | TE | 15.74 | 0.93 | 5200 | |||
| Cooper Kupp | LAR | WR | 20.09 | 1.08 | 7100 | |||
| Jarvis Landry | CLE | WR | 18.85 | 1.88 | 5200 | |||
| Tyler Boyd | CIN | WR | 17.84 | 1.19 | 6300 | |||
| 7508 | 162.29 | 12.17 | Chiefs | KCC | DST | 8.26 | 0.95 | 2500 |
| Lamar Jackson | BAL | QB | 26.99 | 1.41 | 6900 | |||
| Alvin Kamara | NOS | RB | 20.71 | 0.37 | 8000 | |||
| Chris Carson | SEA | RB | 16.76 | 1.17 | 6000 | |||
| Zach Ertz | PHI | TE | 17.22 | 1.40 | 5400 | |||
| DeAndre Hopkins | HOU | WR | 21.08 | 1.12 | 7400 | |||
| DeVante Parker | MIA | WR | 18.98 | 2.37 | 4200 | |||
| Robert Woods | LAR | WR | 17.30 | 1.02 | 5600 | |||
| Jamison Crowder | NYJ | WR | 14.98 | 2.35 | 4000 | |||
| 1526 | 164.61 | 13.07 | Dolphins | MIA | DST | 8.04 | 0.87 | 2700 |
| Lamar Jackson | BAL | QB | 23.37 | 1.41 | 6900 | |||
| Leonard Fournette | JAC | RB | 21.75 | 1.70 | 6700 | |||
| Le’Veon Bell | NYJ | RB | 21.08 | 1.20 | 6400 | |||
| George Kittle | SFO | TE | 15.84 | 0.93 | 5200 | |||
| Cooper Kupp | LAR | WR | 23.14 | 1.08 | 7100 | |||
| DeAndre Hopkins | HOU | WR | 21.94 | 1.12 | 7400 | |||
| Jamison Crowder | NYJ | WR | 15.06 | 2.35 | 4000 | |||
| Devin Smith | DAL | WR | 14.39 | 2.41 | 3600 | |||
| 444 | 164.88 | 13.86 | Jets | NYJ | DST | 6.70 | 1.00 | 1500 |
| Lamar Jackson | BAL | QB | 25.18 | 1.41 | 6900 | |||
| Todd Gurley | LAR | RB | 20.47 | 1.70 | 6200 | |||
| Leonard Fournette | JAC | RB | 19.46 | 1.70 | 6700 | |||
| Mark Andrews | BAL | TE | 16.91 | 2.55 | 4800 | |||
| George Kittle | SFO | TE | 16.64 | 0.93 | 5200 | |||
| DeAndre Hopkins | HOU | WR | 22.10 | 1.12 | 7400 | |||
| Cooper Kupp | LAR | WR | 20.23 | 1.08 | 7100 | |||
| DeVante Parker | MIA | WR | 17.17 | 2.37 | 4200 | |||
| 2001 | 165.75 | 14.70 | Jets | NYJ | DST | 7.00 | 1.00 | 1500 |
| Lamar Jackson | BAL | QB | 27.02 | 1.41 | 6900 | |||
| Dalvin Cook | MIN | RB | 26.99 | 2.51 | 8400 | |||
| Todd Gurley | LAR | RB | 18.74 | 1.70 | 6200 | |||
| Kenyan Drake | MIA | RB | 18.39 | 1.54 | 4400 | |||
| Zach Ertz | PHI | TE | 16.41 | 1.40 | 5400 | |||
| Amari Cooper | DAL | WR | 21.12 | 1.74 | 7000 | |||
| Robert Woods | LAR | WR | 16.30 | 1.02 | 5600 | |||
| DeVante Parker | MIA | WR | 13.78 | 2.37 | 4200 | |||
| 7185 | 165.93 | 14.72 | Jets | NYJ | DST | 6.85 | 1.00 | 1500 |
| Deshaun Watson | HOU | QB | 25.19 | 1.43 | 6700 | |||
| Leonard Fournette | JAC | RB | 21.09 | 1.70 | 6700 | |||
| Le’Veon Bell | NYJ | RB | 20.74 | 1.20 | 6400 | |||
| Devonta Freeman | ATL | RB | 17.96 | 0.98 | 5800 | |||
| George Kittle | SFO | TE | 16.80 | 0.93 | 5200 | |||
| Cooper Kupp | LAR | WR | 21.56 | 1.08 | 7100 | |||
| Amari Cooper | DAL | WR | 20.90 | 1.74 | 7000 | |||
| Jordan Matthews | SFO | WR | 14.84 | 4.65 | 3100 | |||
| 3368 | 166.41 | 16.10 | Jets | NYJ | DST | 7.67 | 1.00 | 1500 |
| Matt Ryan | ATL | QB | 22.19 | 1.21 | 6400 | |||
| Leonard Fournette | JAC | RB | 21.84 | 1.70 | 6700 | |||
| Le’Veon Bell | NYJ | RB | 21.37 | 1.20 | 6400 | |||
| Chris Thompson | WAS | RB | 16.07 | 1.98 | 5000 | |||
| Mark Andrews | BAL | TE | 20.28 | 2.55 | 4800 | |||
| Tyreek Hill | KCC | WR | 21.88 | 4.12 | 6900 | |||
| Adam Thielen | MIN | WR | 18.41 | 1.32 | 6700 | |||
| Robert Woods | LAR | WR | 16.69 | 1.02 | 5600 | |||
| 2489 | 166.54 | 16.16 | Chiefs | KCC | DST | 7.65 | 0.95 | 2500 |
| Lamar Jackson | BAL | QB | 24.95 | 1.41 | 6900 | |||
| Todd Gurley | LAR | RB | 18.70 | 1.70 | 6200 | |||
| Chris Thompson | WAS | RB | 17.44 | 1.98 | 5000 | |||
| Travis Kelce | KCC | TE | 23.03 | 1.85 | 7000 | |||
| Larry Fitzgerald | ARI | WR | 22.80 | 2.26 | 6100 | |||
| Julio Jones | ATL | WR | 22.51 | 1.20 | 8000 | |||
| Jarvis Landry | CLE | WR | 17.60 | 1.88 | 5200 | |||
| Damion Willis | CIN | WR | 11.87 | 2.93 | 3000 | |||
| 7447 | 166.84 | 16.23 | Bengals | CIN | DST | 6.79 | 1.57 | 1700 |
| Baker Mayfield | CLE | QB | 24.32 | 2.32 | 5500 | |||
| Leonard Fournette | JAC | RB | 21.37 | 1.70 | 6700 | |||
| Kenyan Drake | MIA | RB | 15.29 | 1.54 | 4400 | |||
| Travis Kelce | KCC | TE | 20.97 | 1.85 | 7000 | |||
| Cooper Kupp | LAR | WR | 21.63 | 1.08 | 7100 | |||
| DeAndre Hopkins | HOU | WR | 21.39 | 1.12 | 7400 | |||
| Larry Fitzgerald | ARI | WR | 21.28 | 2.26 | 6100 | |||
| Rashard Higgins | CLE | WR | 13.80 | 2.79 | 3700 | |||
| 2683 | 169.99 | 16.33 | Jets | NYJ | DST | 8.26 | 1.00 | 1500 |
| Patrick Mahomes | KCC | QB | 29.70 | 2.39 | 7500 | |||
| Le’Veon Bell | NYJ | RB | 19.26 | 1.20 | 6400 | |||
| Devonta Freeman | ATL | RB | 16.75 | 0.98 | 5800 | |||
| Austin Hooper | ATL | TE | 15.83 | 1.49 | 5000 | |||
| Tyreek Hill | KCC | WR | 26.60 | 4.12 | 6900 | |||
| Larry Fitzgerald | ARI | WR | 20.44 | 2.26 | 6100 | |||
| Jarvis Landry | CLE | WR | 16.96 | 1.88 | 5200 | |||
| Robert Woods | LAR | WR | 16.20 | 1.02 | 5600 | |||
| 8295 | 170.21 | 18.10 | Cardinals | ARI | DST | 9.35 | 1.37 | 1900 |
| Matt Ryan | ATL | QB | 23.40 | 1.21 | 6400 | |||
| David Johnson | ARI | RB | 26.95 | 3.69 | 7600 | |||
| Le’Veon Bell | NYJ | RB | 19.99 | 1.20 | 6400 | |||
| Todd Gurley | LAR | RB | 19.50 | 1.70 | 6200 | |||
| Mark Andrews | BAL | TE | 18.23 | 2.55 | 4800 | |||
| Larry Fitzgerald | ARI | WR | 20.95 | 2.26 | 6100 | |||
| DeAndre Hopkins | HOU | WR | 20.91 | 1.12 | 7400 | |||
| Seth Roberts | BAL | WR | 10.93 | 3.00 | 3000 | |||
| 9396 | 171.20 | 18.50 | Jets | NYJ | DST | 7.03 | 1.00 | 1500 |
| Patrick Mahomes | KCC | QB | 28.60 | 2.39 | 7500 | |||
| Dalvin Cook | MIN | RB | 25.76 | 2.51 | 8400 | |||
| Le’Veon Bell | NYJ | RB | 21.79 | 1.20 | 6400 | |||
| Travis Kelce | KCC | TE | 24.15 | 1.85 | 7000 | |||
| Mark Andrews | BAL | TE | 16.64 | 2.55 | 4800 | |||
| Larry Fitzgerald | ARI | WR | 19.45 | 2.26 | 6100 | |||
| Jamison Crowder | NYJ | WR | 14.33 | 2.35 | 4000 | |||
| DeVante Parker | MIA | WR | 13.44 | 2.37 | 4200 | |||
| 1292 | 171.33 | 18.63 | Cardinals | ARI | DST | 9.75 | 1.37 | 1900 |
| Sam Darnold | NYJ | QB | 28.67 | 5.69 | 5100 | |||
| Nick Chubb | CLE | RB | 23.30 | 1.94 | 7300 | |||
| Leonard Fournette | JAC | RB | 19.67 | 1.70 | 6700 | |||
| Le’Veon Bell | NYJ | RB | 19.35 | 1.20 | 6400 | |||
| Austin Hooper | ATL | TE | 15.60 | 1.49 | 5000 | |||
| Larry Fitzgerald | ARI | WR | 21.54 | 2.26 | 6100 | |||
| DeAndre Hopkins | HOU | WR | 19.51 | 1.12 | 7400 | |||
| Preston Williams | MIA | WR | 13.93 | 1.86 | 4100 | |||
| 4913 | 171.45 | 20.11 | Jets | NYJ | DST | 7.09 | 1.00 | 1500 |
| Patrick Mahomes | KCC | QB | 30.73 | 2.39 | 7500 | |||
| David Johnson | ARI | RB | 26.78 | 3.69 | 7600 | |||
| Le’Veon Bell | NYJ | RB | 21.64 | 1.20 | 6400 | |||
| Mark Andrews | BAL | TE | 17.27 | 2.55 | 4800 | |||
| Julio Jones | ATL | WR | 21.79 | 1.20 | 8000 | |||
| Cooper Kupp | LAR | WR | 19.68 | 1.08 | 7100 | |||
| Jamison Crowder | NYJ | WR | 13.58 | 2.35 | 4000 | |||
| Jordan Matthews | SFO | WR | 12.89 | 4.65 | 3100 | |||
| 5466 | 174.67 | 23.74 | Cardinals | ARI | DST | 7.86 | 1.37 | 1900 |
| Sam Darnold | NYJ | QB | 32.22 | 5.69 | 5100 | |||
| Dalvin Cook | MIN | RB | 24.77 | 2.51 | 8400 | |||
| Todd Gurley | LAR | RB | 18.92 | 1.70 | 6200 | |||
| Zach Ertz | PHI | TE | 16.95 | 1.40 | 5400 | |||
| Amari Cooper | DAL | WR | 22.91 | 1.74 | 7000 | |||
| Larry Fitzgerald | ARI | WR | 20.19 | 2.26 | 6100 | |||
| Tyreek Hill | KCC | WR | 19.85 | 4.12 | 6900 | |||
| Trent Sherfield | ARI | WR | 11.00 | 2.94 | 3000 |
Week 6 optimal lineups can be found here
