
Week 7 Fantasy Football Optimal Lineups
We are BACK with optimal lineups from week 7 simulations!
It was a rough week last week, but that’s going to happen, let’s get back in the driver’s seat this week.
Again, no real changes since last week. If you want to review the overall code for scraping and optimizing projections, the initial post is here.
Setup
library(data.table)
library(dtplyr)
library(tidyverse)
library(rPref)
library(kableExtra)

week <- 7

proj <- readRDS(paste0('week_', week, '_proj.RDS'))

sal <- read_csv(paste0('DKSalaries_wk_', week, '.csv'))
I’ll start with the optimized lineups pulled for week 4, with the same details as last time: 10,000 lineups, using the standard deviation of projections, completely individually based (still working on that).
sim_lu <- readRDS(paste0('sim_lineups_week_', week, '.RDS')) %>%
  rename(pts_base=points) %>%
  select(lineup, Name, team, position, pts_base, pts_pred, sd_pts, Salary)

glimpse(sim_lu)
## Observations: 90,000
## Variables: 8
## Groups: Name [141]
## $ lineup <int> 1, 1, 1, 1, 1, 1, 1, 1, 1, 2, 2, 2, 2, 2, 2, 2, 2, 2,...
## $ Name <chr> "Dolphins", "Tevin Coleman", "Tyler Boyd", "Dalvin Co...
## $ team <chr> "MIA", "SFO", "CIN", "MIN", "JAC", "NYG", "DET", "BAL...
## $ position <chr> "DST", "RB", "WR", "RB", "RB", "TE", "WR", "QB", "WR"...
## $ pts_base <dbl> 5.644063, 12.685534, 14.962621, 20.578049, 21.115060,...
## $ pts_pred <dbl> 7.085018, 17.527696, 15.747588, 21.363833, 24.120519,...
## $ sd_pts <dbl> 1.0239833, 1.8186888, 1.1493671, 0.9237673, 2.0700289...
## $ Salary <dbl> 1500, 5600, 5600, 8000, 7000, 6500, 5800, 6800, 3000,...sim_lu %>%
filter(lineup<=3) %>%
arrange(lineup, position, desc(pts_pred)) %>%
mutate_at(vars(pts_base, pts_pred, sd_pts), function(x) round(x, 2)) %>%
knitr::kable() %>%
kable_styling() %>%
column_spec(1, bold=TRUE) %>%
collapse_rows(columns = 1, valign = 'top') %>%
scroll_box(height = '600px', width = '100%')| lineup | Name | team | position | pts_base | pts_pred | sd_pts | Salary |
|---|---|---|---|---|---|---|---|
| 1 | Dolphins | MIA | DST | 5.64 | 7.09 | 1.02 | 1500 |
| Lamar Jackson | BAL | QB | 22.67 | 23.04 | 1.01 | 6800 | |
| Leonard Fournette | JAC | RB | 21.12 | 24.12 | 2.07 | 7000 | |
| Dalvin Cook | MIN | RB | 20.58 | 21.36 | 0.92 | 8000 | |
| Tevin Coleman | SFO | RB | 12.69 | 17.53 | 1.82 | 5600 | |
| Evan Engram | NYG | TE | 15.65 | 17.63 | 2.33 | 6500 | |
| Kenny Golladay | DET | WR | 15.40 | 16.64 | 2.07 | 5800 | |
| Tyler Boyd | CIN | WR | 14.96 | 15.75 | 1.15 | 5600 | |
| Allen Lazard | GBP | WR | 9.80 | 10.98 | 1.74 | 3000 | |
| 2 | Colts | IND | DST | 6.44 | 6.90 | 1.06 | 2000 |
| Deshaun Watson | HOU | QB | 22.24 | 23.34 | 0.98 | 7000 | |
| Leonard Fournette | JAC | RB | 21.12 | 22.89 | 2.07 | 7000 | |
| Chris Carson | SEA | RB | 16.97 | 17.84 | 1.32 | 6500 | |
| Latavius Murray | NOS | RB | 11.35 | 15.92 | 3.07 | 5100 | |
| Darren Waller | OAK | TE | 13.53 | 17.19 | 3.21 | 4700 | |
| Tyler Lockett | SEA | WR | 16.26 | 20.04 | 2.02 | 6600 | |
| Cooper Kupp | LAR | WR | 19.25 | 19.31 | 1.64 | 7400 | |
| Chris Conley | JAC | WR | 7.86 | 12.27 | 1.68 | 3500 | |
| 3 | Lions | DET | DST | 6.37 | 8.02 | 0.69 | 2300 |
| Lamar Jackson | BAL | QB | 22.67 | 23.25 | 1.01 | 6800 | |
| Latavius Murray | NOS | RB | 11.35 | 16.31 | 3.07 | 5100 | |
| David Montgomery | CHI | RB | 12.09 | 15.11 | 1.99 | 4800 | |
| Darren Waller | OAK | TE | 13.53 | 16.47 | 3.21 | 4700 | |
| DeAndre Hopkins | HOU | WR | 18.33 | 21.86 | 2.44 | 7800 | |
| Keenan Allen | LAC | WR | 17.17 | 19.56 | 2.27 | 6700 | |
| T.Y. Hilton | IND | WR | 16.98 | 18.05 | 1.77 | 5900 | |
| Tyler Boyd | CIN | WR | 14.96 | 17.35 | 1.15 | 5600 |
Who is in Optimal Lineups?
sim_lu %>%
  group_by(Name, position, Salary) %>%
  dplyr::summarize(lu=n_distinct(lineup)) %>%
  ungroup() %>%
  group_by(position) %>%
  top_n(10, lu) %>%
  ungroup() %>%
  arrange(position, desc(lu)) %>%
  mutate(Name=factor(Name),
         Name=fct_reorder(Name, lu)) %>%
  ggplot(aes(x=Name, y=lu/1000, fill=Salary)) +
  geom_bar(stat='identity') +
  facet_wrap(~position, ncol = 3, scales='free') +
  coord_flip() +
  scale_y_continuous(labels = scales::comma) +
  scale_fill_viridis_c() +
  xlab('') +
  ylab('Lineups (Thousands)') +
ggtitle('Top 10 Players Present by Position') 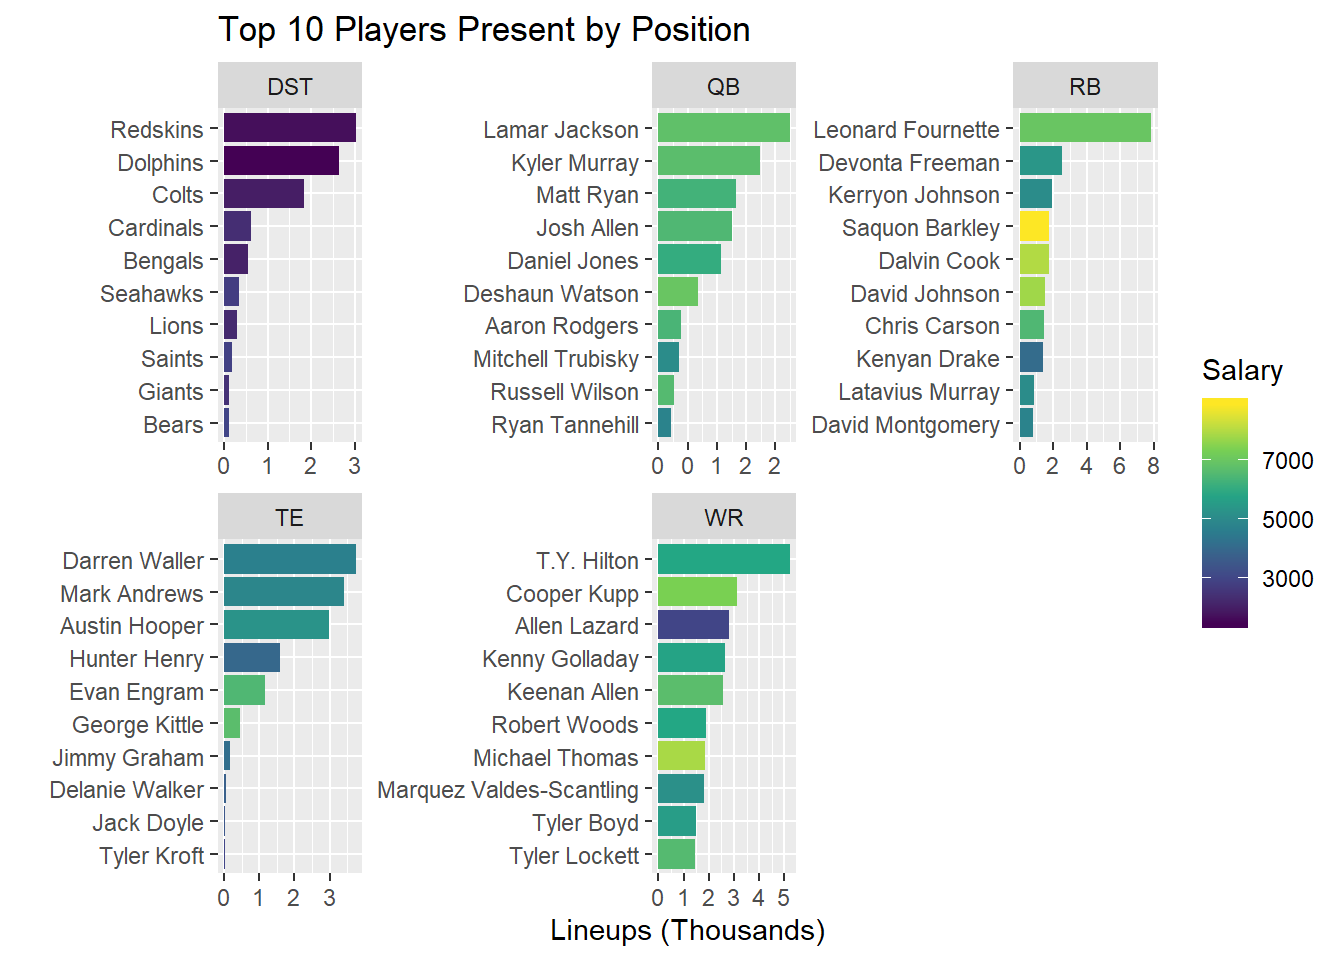
Some of my observations:
Lots of parity at the QB spot. Lamar Jackson and Kyler Murray are most present, but there’s a linear decline.
Leonard Fournette is a heavy favorite at RB, showing up in almost 80% of lineups. Kenyan Drake appears to be the value play again (lets hope he gets a better play call for that 2 pt conversion this time).
T.Y. Hilton is the favorite at WR, showing up in almost 50% of lineups, Cooper Kupp comes in second by a fair margin (He was a dud last week, but hey, that means my Niners are awesome, so I’ll take it.). Allen Lazard appears to be the value play
It’s the usual story at TE, there are only a few worth playing.
Redskins, Dolphins, and Colts are the most common defenses most likely due to their price. Over the last few weeks, the model has selected the Defenses with the lowest prices.
Who is getting placed in Lineups?
DraftKings provides scoring for 391 players this week, but only 141 make it into optimized lineups. Why is that? To determine, I’ll plot projected points vs salary, colored by whether or not they make it into optimized lineups, and sized by their projection standard deviation
plyr_lu <- sim_lu %>%
  group_by(Name, position) %>%
  dplyr::summarize(lu=n_distinct(lineup)) %>%
  ungroup()

proj %>%
  filter(avg_type=='weighted') %>%
  mutate(Name = ifelse(pos=="DST", last_name, paste(first_name, last_name))) %>%
  inner_join(sal, by=c("Name")) %>%
  select(Name, team, position, points, Salary, sd_pts) %>%
  left_join(plyr_lu, by='Name') %>%
  replace_na(list(lu=0)) %>%
  mutate(lu_bin=ifelse(lu==0, '0 Lineups', '>=1 Lineups'),
         lu_5=cut(lu,5, labels = FALSE)) %>%
  ggplot(aes(x=Salary, y=points, color=lu_bin, size=sd_pts)) +
  geom_point() +
  scale_color_manual(values = c('red', 'blue'), name="") +
  geom_smooth(inherit.aes = FALSE, aes(x=Salary, y=points), method = 'lm', se=FALSE) +
  ylab('Projected Points') +
  xlab('Salary') +
  ggtitle('Who makes it into Optimized Lineups?') +
  scale_x_continuous(labels=scales::dollar)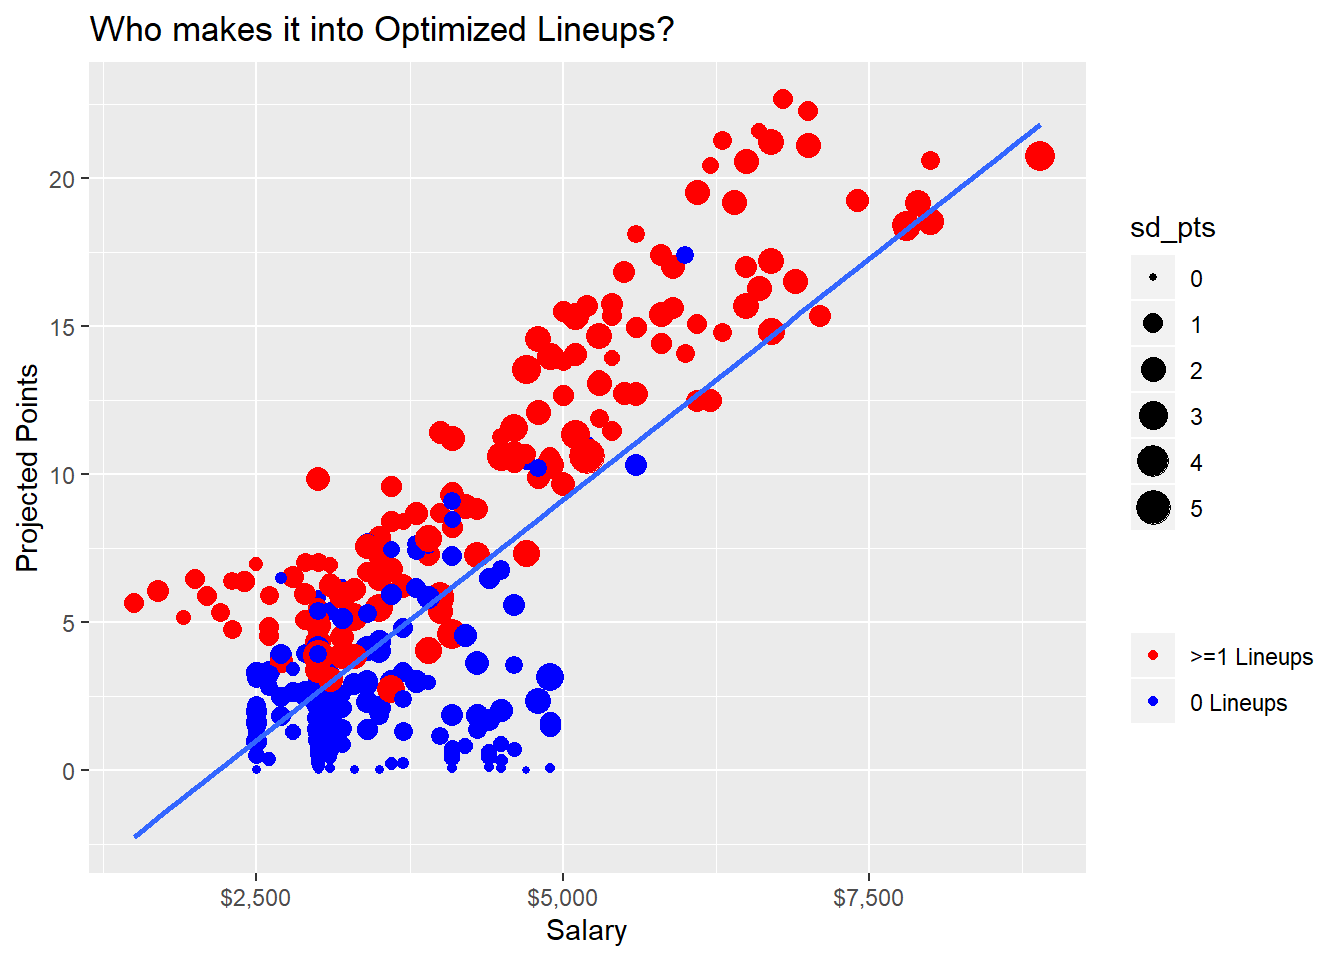
This week, not many players below the line get into lineups, but some above get excluded due to their small uncertainty. Remember, this method takes players who have the potential to blow up rather than players with solid floors.
Flex Configurations
In DFS lineups, you have an extra spot to use on an RB, WR, and TE of your chosing
sim_lu %>%
  group_by(lineup) %>%
  mutate(lineup_pts=sum(pts_pred)) %>%
  group_by(lineup, position) %>%
  mutate(n=n()) %>%
  select(lineup, position, n, lineup_pts) %>%
  distinct() %>%
  spread(key=position, value=n) %>%
  filter(RB>=2, TE>=1, WR>=3) %>%
  mutate(flex=case_when(RB==3 ~ 'RB',
                        TE==2 ~ 'TE',
                        WR==4 ~ 'WR')) %>%
  group_by(flex) %>%
  dplyr::summarize(pts=median(lineup_pts),
                   cases=n()) %>%
  knitr::kable() %>%
kable_styling(full_width = FALSE)| flex | pts | cases |
|---|---|---|
| RB | 157.0205 | 3887 |
| TE | 158.4635 | 3681 |
| WR | 157.8967 | 2432 |
Pretty even flex configurations, with RBs being the most popular TE’s the secons, and WR’s a distance third
Pareto Lineups
lu_df <- sim_lu %>%
  group_by(lineup) %>%
  dplyr::summarize(lineup_pts=sum(pts_pred),
                   lineup_sd=sum(sd_pts)) %>%
  ungroup()

pto <- psel(lu_df, low(lineup_sd) * high(lineup_pts))


ggplot(lu_df, aes(y=lineup_pts, x=lineup_sd)) +
  geom_point() +
  geom_point(data=pto, size=5) +
  ylab('Lineup Points') +
  xlab('Lineup Points St Dev') +
  ggtitle('Lineup Points vs Uncertainty',
          subtitle = 'Pareto Lineups Bolded')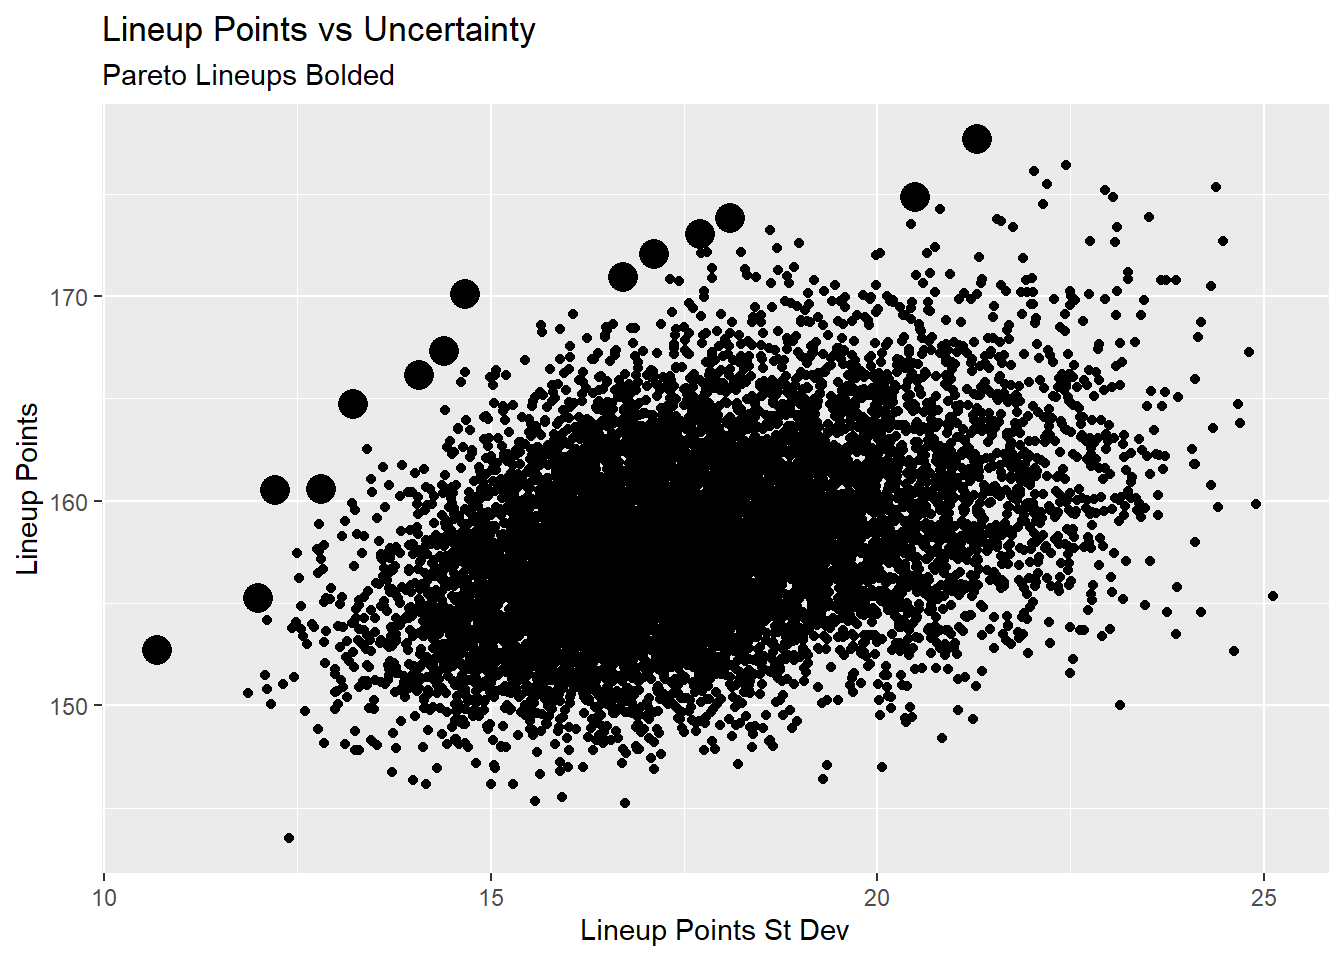
Here’s a look at the pareto lineups.
psel(lu_df, low(lineup_sd) * high(lineup_pts)) %>%
  left_join(sim_lu, by='lineup') %>%
  group_by(lineup) %>%
  arrange(lineup_pts, position, desc(pts_pred)) %>%
  select(lineup, lineup_pts, lineup_sd, Name, team, position, pts_pred, sd_pts, Salary) %>%
  mutate_at(vars(lineup_pts, lineup_sd, pts_pred, sd_pts), function(x) round(x, 2)) %>%
  knitr::kable() %>%
  kable_styling(fixed_thead = T) %>%
  column_spec(1:3, bold=TRUE) %>%
  collapse_rows(columns = 1:3, valign = 'top') %>%
scroll_box(height = '500px', width = '100%')| lineup | lineup_pts | lineup_sd | Name | team | position | pts_pred | sd_pts | Salary |
|---|---|---|---|---|---|---|---|---|
| 8896 | 152.69 | 10.69 | Ravens | BAL | DST | 7.27 | 0.92 | 2200 |
| Matt Ryan | ATL | QB | 22.62 | 0.89 | 6300 | |||
| Dalvin Cook | MIN | RB | 22.17 | 0.92 | 8000 | |||
| Leonard Fournette | JAC | RB | 20.61 | 2.07 | 7000 | |||
| Devonta Freeman | ATL | RB | 16.44 | 1.10 | 5400 | |||
| Hunter Henry | LAC | TE | 16.11 | 1.59 | 4000 | |||
| Tyler Boyd | CIN | WR | 15.91 | 1.15 | 5600 | |||
| Larry Fitzgerald | ARI | WR | 15.86 | 0.98 | 6100 | |||
| Calvin Ridley | ATL | WR | 15.69 | 1.07 | 5300 | |||
| 95 | 155.26 | 11.99 | Dolphins | MIA | DST | 5.82 | 1.02 | 1500 |
| Lamar Jackson | BAL | QB | 24.47 | 1.01 | 6800 | |||
| Leonard Fournette | JAC | RB | 24.87 | 2.07 | 7000 | |||
| Dalvin Cook | MIN | RB | 21.26 | 0.92 | 8000 | |||
| Kerryon Johnson | DET | RB | 15.99 | 1.61 | 5100 | |||
| Hunter Henry | LAC | TE | 12.63 | 1.59 | 4000 | |||
| T.Y. Hilton | IND | WR | 18.34 | 1.77 | 5900 | |||
| Stefon Diggs | MIN | WR | 16.73 | 0.93 | 6300 | |||
| Calvin Ridley | ATL | WR | 15.16 | 1.07 | 5300 | |||
| 4225 | 160.51 | 12.21 | Dolphins | MIA | DST | 6.87 | 1.02 | 1500 |
| Russell Wilson | SEA | QB | 21.65 | 0.45 | 6600 | |||
| Leonard Fournette | JAC | RB | 25.57 | 2.07 | 7000 | |||
| Chris Carson | SEA | RB | 21.97 | 1.32 | 6500 | |||
| Devonta Freeman | ATL | RB | 16.46 | 1.10 | 5400 | |||
| Hunter Henry | LAC | TE | 13.05 | 1.59 | 4000 | |||
| Keenan Allen | LAC | WR | 20.62 | 2.27 | 6700 | |||
| Robert Woods | LAR | WR | 18.18 | 1.47 | 5900 | |||
| Stefon Diggs | MIN | WR | 16.13 | 0.93 | 6300 | |||
| 7601 | 160.55 | 12.80 | Redskins | WAS | DST | 7.24 | 1.35 | 1700 |
| Lamar Jackson | BAL | QB | 22.49 | 1.01 | 6800 | |||
| Leonard Fournette | JAC | RB | 24.24 | 2.07 | 7000 | |||
| Dalvin Cook | MIN | RB | 21.67 | 0.92 | 8000 | |||
| Devonta Freeman | ATL | RB | 17.38 | 1.10 | 5400 | |||
| Hunter Henry | LAC | TE | 13.89 | 1.59 | 4000 | |||
| Keenan Allen | LAC | WR | 21.47 | 2.27 | 6700 | |||
| T.Y. Hilton | IND | WR | 19.98 | 1.77 | 5900 | |||
| Auden Tate | CIN | WR | 12.20 | 0.74 | 4500 | |||
| 8770 | 164.73 | 13.21 | Dolphins | MIA | DST | 6.98 | 1.02 | 1500 |
| Lamar Jackson | BAL | QB | 23.62 | 1.01 | 6800 | |||
| Dalvin Cook | MIN | RB | 20.61 | 0.92 | 8000 | |||
| Devonta Freeman | ATL | RB | 17.73 | 1.10 | 5400 | |||
| Kenyan Drake | MIA | RB | 15.72 | 2.03 | 4100 | |||
| Hunter Henry | LAC | TE | 13.04 | 1.59 | 4000 | |||
| Adam Thielen | MIN | WR | 22.69 | 2.14 | 6900 | |||
| T.Y. Hilton | IND | WR | 22.39 | 1.77 | 5900 | |||
| Cooper Kupp | LAR | WR | 21.95 | 1.64 | 7400 | |||
| 1388 | 166.16 | 14.07 | Giants | NYG | DST | 7.18 | 0.25 | 2500 |
| Matt Ryan | ATL | QB | 24.05 | 0.89 | 6300 | |||
| Leonard Fournette | JAC | RB | 25.33 | 2.07 | 7000 | |||
| Saquon Barkley | NYG | RB | 24.64 | 3.31 | 8900 | |||
| Josh Jacobs | OAK | RB | 15.51 | 0.81 | 5000 | |||
| Hunter Henry | LAC | TE | 13.70 | 1.59 | 4000 | |||
| T.Y. Hilton | IND | WR | 22.84 | 1.77 | 5900 | |||
| Cooper Kupp | LAR | WR | 21.77 | 1.64 | 7400 | |||
| Allen Lazard | GBP | WR | 11.13 | 1.74 | 3000 | |||
| 507 | 167.32 | 14.40 | Cardinals | ARI | DST | 9.36 | 1.15 | 2400 |
| Josh Allen | BUF | QB | 23.67 | 2.07 | 6500 | |||
| Leonard Fournette | JAC | RB | 27.58 | 2.07 | 7000 | |||
| Dalvin Cook | MIN | RB | 22.26 | 0.92 | 8000 | |||
| Mark Andrews | BAL | TE | 18.61 | 2.51 | 4900 | |||
| T.Y. Hilton | IND | WR | 20.29 | 1.77 | 5900 | |||
| Robert Woods | LAR | WR | 17.41 | 1.47 | 5900 | |||
| Tyler Boyd | CIN | WR | 16.23 | 1.15 | 5600 | |||
| Jake Kumerow | GBP | WR | 11.90 | 1.30 | 3600 | |||
| 4923 | 170.09 | 14.66 | Redskins | WAS | DST | 9.34 | 1.35 | 1700 |
| Deshaun Watson | HOU | QB | 24.32 | 0.98 | 7000 | |||
| Leonard Fournette | JAC | RB | 23.97 | 2.07 | 7000 | |||
| Devonta Freeman | ATL | RB | 16.09 | 1.10 | 5400 | |||
| Evan Engram | NYG | TE | 22.20 | 2.33 | 6500 | |||
| Hunter Henry | LAC | TE | 15.03 | 1.59 | 4000 | |||
| T.Y. Hilton | IND | WR | 22.00 | 1.77 | 5900 | |||
| Robert Woods | LAR | WR | 19.34 | 1.47 | 5900 | |||
| Tyler Lockett | SEA | WR | 17.82 | 2.02 | 6600 | |||
| 9355 | 170.95 | 16.71 | Dolphins | MIA | DST | 7.32 | 1.02 | 1500 |
| Lamar Jackson | BAL | QB | 23.26 | 1.01 | 6800 | |||
| Leonard Fournette | JAC | RB | 24.80 | 2.07 | 7000 | |||
| Dalvin Cook | MIN | RB | 20.80 | 0.92 | 8000 | |||
| Austin Hooper | ATL | TE | 22.73 | 2.30 | 5300 | |||
| Darren Waller | OAK | TE | 15.27 | 3.21 | 4700 | |||
| Michael Thomas | NOS | WR | 25.68 | 2.37 | 7900 | |||
| Kenny Golladay | DET | WR | 18.28 | 2.07 | 5800 | |||
| Allen Lazard | GBP | WR | 12.81 | 1.74 | 3000 | |||
| 4991 | 172.08 | 17.11 | Colts | IND | DST | 7.53 | 1.06 | 2000 |
| Josh Allen | BUF | QB | 24.51 | 2.07 | 6500 | |||
| Leonard Fournette | JAC | RB | 22.31 | 2.07 | 7000 | |||
| Kerryon Johnson | DET | RB | 15.43 | 1.61 | 5100 | |||
| Austin Hooper | ATL | TE | 22.00 | 2.30 | 5300 | |||
| Mark Andrews | BAL | TE | 20.40 | 2.51 | 4900 | |||
| Cooper Kupp | LAR | WR | 21.20 | 1.64 | 7400 | |||
| T.Y. Hilton | IND | WR | 19.87 | 1.77 | 5900 | |||
| Kenny Golladay | DET | WR | 18.84 | 2.07 | 5800 | |||
| 7477 | 173.02 | 17.71 | Colts | IND | DST | 8.66 | 1.06 | 2000 |
| Kyler Murray | ARI | QB | 26.10 | 2.28 | 6700 | |||
| Leonard Fournette | JAC | RB | 23.52 | 2.07 | 7000 | |||
| Devonta Freeman | ATL | RB | 16.50 | 1.10 | 5400 | |||
| Darren Waller | OAK | TE | 21.40 | 3.21 | 4700 | |||
| Mark Andrews | BAL | TE | 16.38 | 2.51 | 4900 | |||
| Cooper Kupp | LAR | WR | 20.55 | 1.64 | 7400 | |||
| Kenny Golladay | DET | WR | 20.03 | 2.07 | 5800 | |||
| T.Y. Hilton | IND | WR | 19.88 | 1.77 | 5900 | |||
| 6284 | 173.79 | 18.10 | Dolphins | MIA | DST | 6.55 | 1.02 | 1500 |
| Jared Goff | LAR | QB | 21.13 | 0.60 | 6200 | |||
| Leonard Fournette | JAC | RB | 24.20 | 2.07 | 7000 | |||
| Chris Carson | SEA | RB | 19.14 | 1.32 | 6500 | |||
| Austin Hooper | ATL | TE | 17.76 | 2.30 | 5300 | |||
| Marquez Valdes-Scantling | GBP | WR | 27.61 | 5.42 | 5200 | |||
| Adam Thielen | MIN | WR | 23.50 | 2.14 | 6900 | |||
| Kenny Golladay | DET | WR | 17.44 | 2.07 | 5800 | |||
| Tyler Boyd | CIN | WR | 16.46 | 1.15 | 5600 | |||
| 8512 | 174.84 | 20.49 | Redskins | WAS | DST | 8.72 | 1.35 | 1700 |
| Lamar Jackson | BAL | QB | 24.37 | 1.01 | 6800 | |||
| Saquon Barkley | NYG | RB | 33.16 | 3.31 | 8900 | |||
| Leonard Fournette | JAC | RB | 21.35 | 2.07 | 7000 | |||
| Chris Carson | SEA | RB | 19.19 | 1.32 | 6500 | |||
| Mark Andrews | BAL | TE | 18.81 | 2.51 | 4900 | |||
| Marquez Valdes-Scantling | GBP | WR | 19.56 | 5.42 | 5200 | |||
| T.Y. Hilton | IND | WR | 18.48 | 1.77 | 5900 | |||
| Allen Lazard | GBP | WR | 11.21 | 1.74 | 3000 | |||
| 1184 | 177.66 | 21.29 | Dolphins | MIA | DST | 7.62 | 1.02 | 1500 |
| Matt Ryan | ATL | QB | 22.76 | 0.89 | 6300 | |||
| Saquon Barkley | NYG | RB | 24.13 | 3.31 | 8900 | |||
| Devonta Freeman | ATL | RB | 17.73 | 1.10 | 5400 | |||
| Austin Hooper | ATL | TE | 18.28 | 2.30 | 5300 | |||
| Darren Waller | OAK | TE | 16.33 | 3.21 | 4700 | |||
| Marquez Valdes-Scantling | GBP | WR | 28.55 | 5.42 | 5200 | |||
| T.Y. Hilton | IND | WR | 21.89 | 1.77 | 5900 | |||
| Keenan Allen | LAC | WR | 20.37 | 2.27 | 6700 |
Week 7 optimal lineups can be found here
