
Week 8 DraftKings Optimal Lineups
We are BACK with optimal lineups from week 8 simulations!
Better week last week, even with Devonta Freeman (who we had a lot of exposure to) picking an ill-advised fight. Kenny Golladay also flopped, but not due to a bad game script. If you tell me there’s a game where the Lions will have 4 recieving TD’s, I’ll take him 9 times out of 10. All of those happened to go to MJJ, but that was a winning game script for Lions recievers. Just shows the importance of thinking through process over results.
If you want to review the overall code for scraping and optimizing projections, the initial post is here.
Setup
library(data.table)
library(dtplyr)
library(tidyverse)
library(rPref)
library(kableExtra)

week <- 8

proj <- readRDS(paste0('week_', week, '_proj.RDS'))

sal <- read_csv(paste0('DKSalaries_wk_', week, '.csv'))
I’ll start with the optimized lineups pulled for week 4, with the same details as last time: 10,000 lineups, using the standard deviation of projections, completely individually based (still working on that).
sim_lu <- readRDS(paste0('sim_lineups_week_', week, '.RDS')) %>%
  rename(pts_base=points) %>%
  select(lineup, Name, team, position, pts_base, pts_pred, sd_pts, Salary)

glimpse(sim_lu)
## Observations: 90,000
## Variables: 8
## Groups: Name [169]
## $ lineup <int> 1, 1, 1, 1, 1, 1, 1, 1, 1, 2, 2, 2, 2, 2, 2, 2, 2, 2,...
## $ Name <chr> "Jaguars", "DeAndre Hopkins", "Josh Hill", "Cameron B...
## $ team <chr> "JAC", "HOU", "NOS", "TBB", "LAR", "CIN", "HOU", "DET...
## $ position <chr> "DST", "WR", "TE", "TE", "RB", "WR", "QB", "WR", "RB"...
## $ pts_base <dbl> 8.296376, 21.096072, 7.121320, 7.771596, 17.685417, 1...
## $ pts_pred <dbl> 11.160235, 22.598214, 11.408854, 9.940246, 20.022272,...
## $ sd_pts <dbl> 1.7968880, 0.8933727, 1.7777746, 1.2992043, 1.6497544...
## $ Salary <dbl> 2900, 8100, 3200, 2700, 7400, 5100, 7100, 6400, 7000,...sim_lu %>%
filter(lineup<=3) %>%
arrange(lineup, position, desc(pts_pred)) %>%
mutate_at(vars(pts_base, pts_pred, sd_pts), function(x) round(x, 2)) %>%
knitr::kable() %>%
kable_styling() %>%
column_spec(1, bold=TRUE) %>%
collapse_rows(columns = 1, valign = 'top') %>%
scroll_box(height = '600px', width = '100%')| lineup | Name | team | position | pts_base | pts_pred | sd_pts | Salary |
|---|---|---|---|---|---|---|---|
| 1 | Jaguars | JAC | DST | 8.30 | 11.16 | 1.80 | 2900 |
| Deshaun Watson | HOU | QB | 24.03 | 24.96 | 1.21 | 7100 | |
| Todd Gurley | LAR | RB | 17.69 | 20.02 | 1.65 | 7400 | |
| Chris Carson | SEA | RB | 18.08 | 19.19 | 1.47 | 7000 | |
| Josh Hill | NOS | TE | 7.12 | 11.41 | 1.78 | 3200 | |
| Cameron Brate | TBB | TE | 7.77 | 9.94 | 1.30 | 2700 | |
| DeAndre Hopkins | HOU | WR | 21.10 | 22.60 | 0.89 | 8100 | |
| Kenny Golladay | DET | WR | 16.28 | 18.61 | 1.93 | 6400 | |
| Tyler Boyd | CIN | WR | 13.84 | 14.66 | 1.27 | 5100 | |
| 2 | Raiders | OAK | DST | 5.77 | 6.65 | 0.88 | 1500 |
| Teddy Bridgewater | NOS | QB | 16.16 | 22.43 | 4.41 | 5900 | |
| Chris Carson | SEA | RB | 18.08 | 19.55 | 1.47 | 7000 | |
| Le’Veon Bell | NYJ | RB | 17.46 | 19.41 | 1.83 | 6900 | |
| David Montgomery | CHI | RB | 11.43 | 13.97 | 1.73 | 4400 | |
| Cameron Brate | TBB | TE | 7.77 | 8.65 | 1.30 | 2700 | |
| Michael Thomas | NOS | WR | 21.39 | 23.19 | 2.67 | 8000 | |
| Cooper Kupp | LAR | WR | 17.70 | 21.94 | 2.08 | 7500 | |
| T.Y. Hilton | IND | WR | 16.04 | 17.54 | 1.93 | 6100 | |
| 3 | Lions | DET | DST | 7.61 | 9.31 | 1.08 | 2800 |
| Matthew Stafford | DET | QB | 19.88 | 21.01 | 1.07 | 6100 | |
| Chris Carson | SEA | RB | 18.08 | 19.25 | 1.47 | 7000 | |
| Ty Johnson | DET | RB | 12.26 | 17.48 | 1.54 | 4900 | |
| David Montgomery | CHI | RB | 11.43 | 15.80 | 1.73 | 4400 | |
| Josh Hill | NOS | TE | 7.12 | 11.11 | 1.78 | 3200 | |
| Michael Thomas | NOS | WR | 21.39 | 22.79 | 2.67 | 8000 | |
| Cooper Kupp | LAR | WR | 17.70 | 19.37 | 2.08 | 7500 | |
| T.Y. Hilton | IND | WR | 16.04 | 17.13 | 1.93 | 6100 |
Who is in Optimal Lineups?
sim_lu %>%
  group_by(Name, position, Salary) %>%
  dplyr::summarize(lu=n_distinct(lineup)) %>%
  ungroup() %>%
  group_by(position) %>%
  top_n(10, lu) %>%
  ungroup() %>%
  arrange(position, desc(lu)) %>%
  mutate(Name=factor(Name),
         Name=fct_reorder(Name, lu)) %>%
  ggplot(aes(x=Name, y=lu/1000, fill=Salary)) +
  geom_bar(stat='identity') +
  facet_wrap(~position, ncol = 3, scales='free') +
  coord_flip() +
  scale_y_continuous(labels = scales::comma) +
  scale_fill_viridis_c() +
  xlab('') +
  ylab('Lineups (Thousands)') +
ggtitle('Top 10 Players Present by Position') 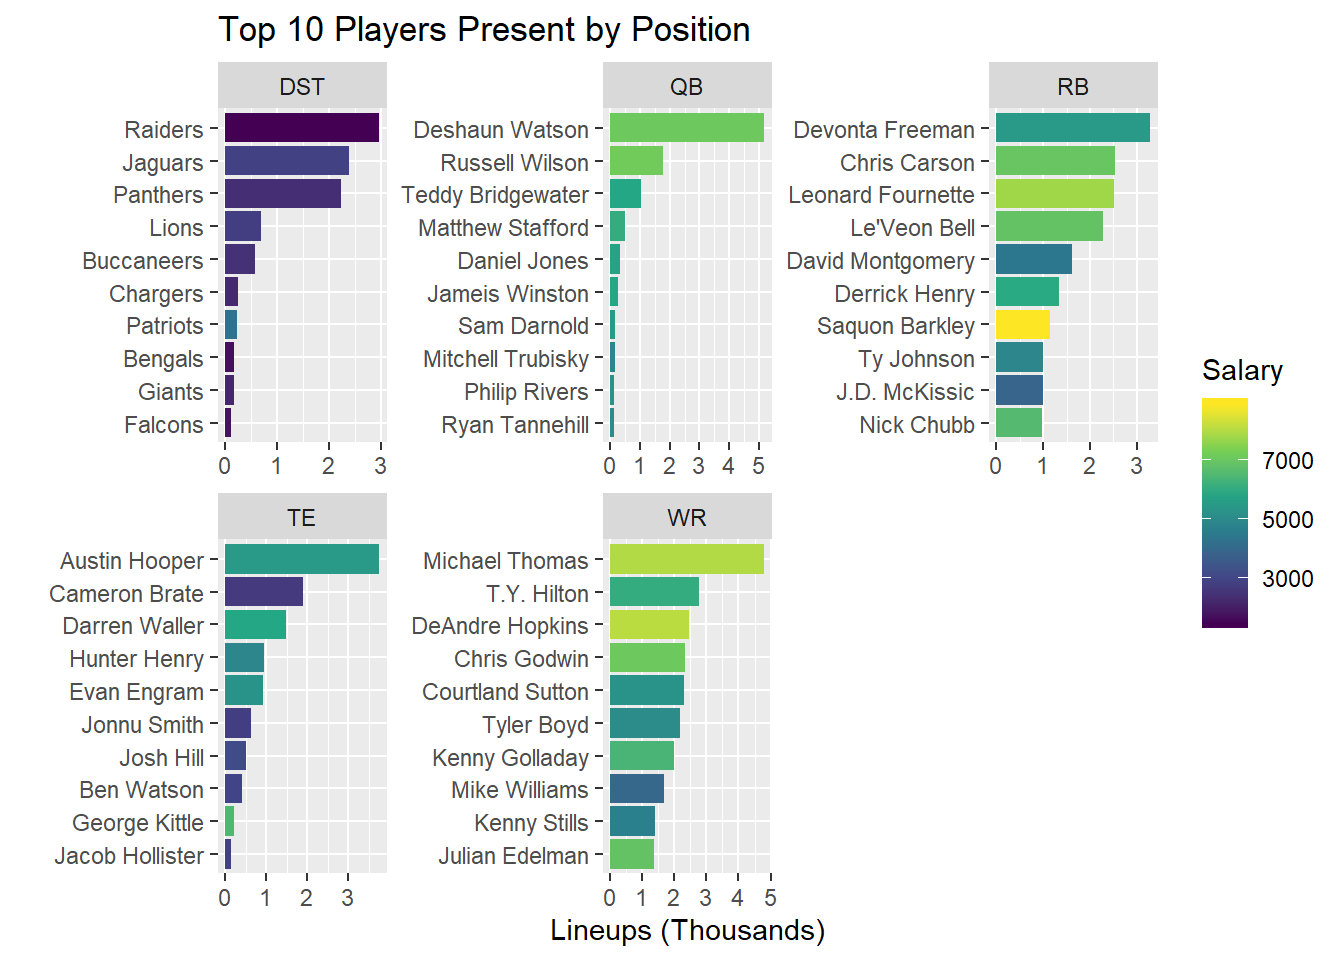
Some of my observations:
We’ve kind of seen QBs go back and forth between one heavy favorite and lots of parity. This is one of the heavy favorite weeks, with DeShaun Watson is over half of lineups. (Note, I removed Matt Ryan from being considered due to him being unlikely to play)
Conversely this is a week with lots of parity at the RB spot. Devonta Freeman is in the most lineups, likely due to his modest price. They’re still pricing Saquon Barkley VERY high.
Michael Thomas is the favorite at WR, showing up in almost 50% of lineups, followed up by a group of WRs. Interestingly Boyd has been a play for most weeks, these analysts are seemingly big on a rebound for him.
It’s the usual story at TE, there are only a few worth playing. Usually there’s two tiers, but this week Austin Hooper looks to be a big favorite.
Raiders, Jags and Panthers are the most common defenses most likely due to their price. Over the last few weeks, the model has selected the Defenses with the lowest prices.
Who is getting placed in Lineups?
DraftKings provides scoring for 425 players this week, but only 169 make it into optimized lineups. Why is that? To determine, I’ll plot projected points vs salary, colored by whether or not they make it into optimized lineups, and sized by their projection standard deviation
plyr_lu <- sim_lu %>%
  group_by(Name, position) %>%
  dplyr::summarize(lu=n_distinct(lineup)) %>%
  ungroup()

proj %>%
  filter(avg_type=='weighted') %>%
  mutate(Name = ifelse(pos=="DST", last_name, paste(first_name, last_name))) %>%
  inner_join(sal, by=c("Name")) %>%
  select(Name, team, position, points, Salary, sd_pts) %>%
  left_join(plyr_lu, by='Name') %>%
  replace_na(list(lu=0)) %>%
  mutate(lu_bin=ifelse(lu==0, '0 Lineups', '>=1 Lineups'),
         lu_5=cut(lu,5, labels = FALSE)) %>%
  ggplot(aes(x=Salary, y=points, color=lu_bin, size=sd_pts)) +
  geom_point() +
  scale_color_manual(values = c('red', 'blue'), name="") +
  geom_smooth(inherit.aes = FALSE, aes(x=Salary, y=points), method = 'lm', se=FALSE) +
  ylab('Projected Points') +
  xlab('Salary') +
  ggtitle('Who makes it into Optimized Lineups?') +
  scale_x_continuous(labels=scales::dollar)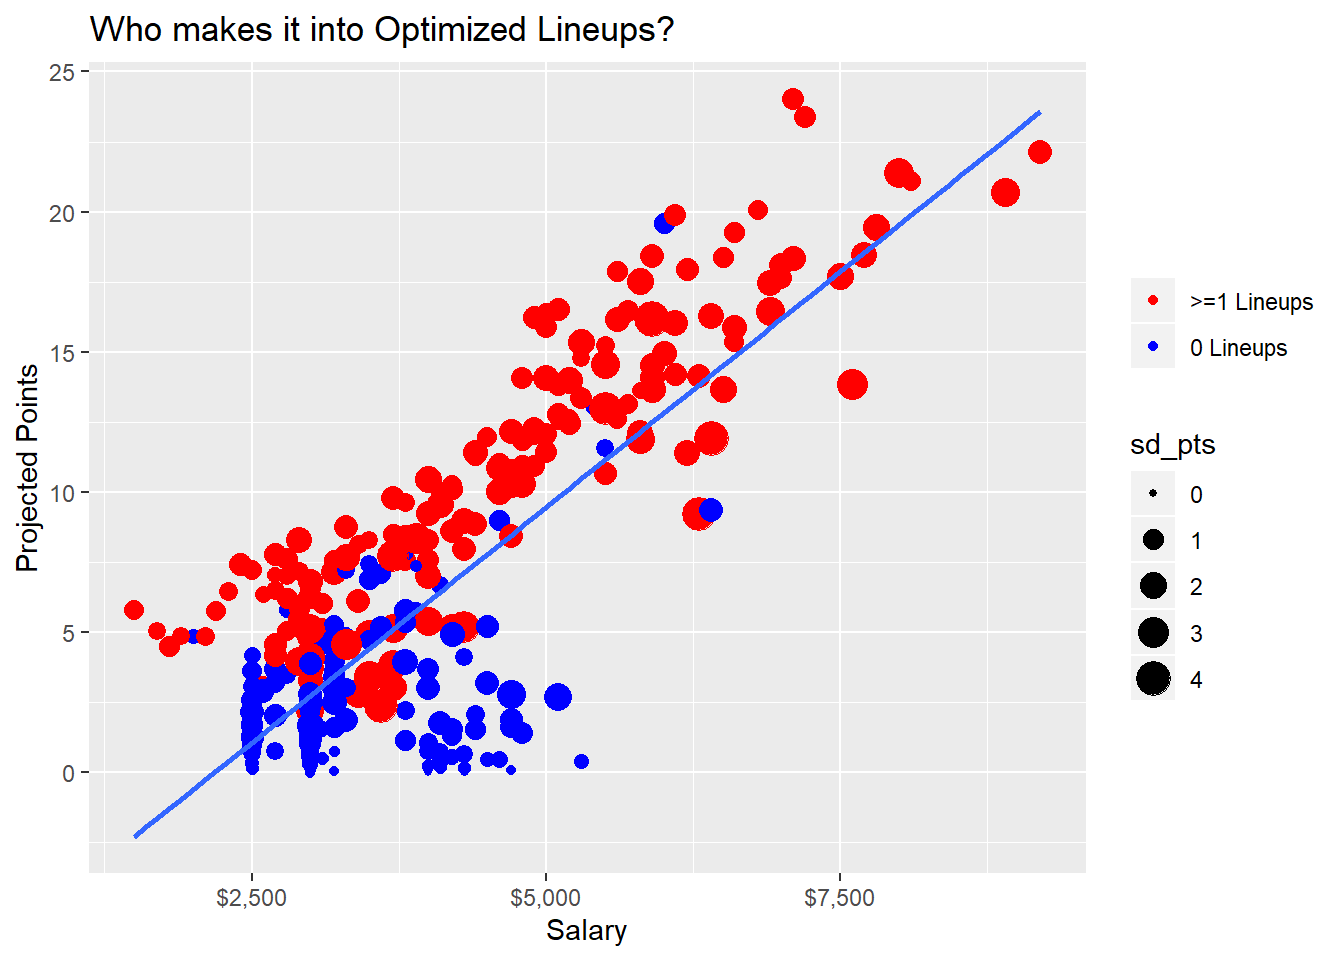
This week, not many players below the line get into lineups, but some above get excluded due to their small uncertainty. Remember, this method takes players who have the potential to blow up rather than players with solid floors.
Flex Configurations
In DFS lineups, you have an extra spot to use on an RB, WR, and TE of your chosing
sim_lu %>%
  group_by(lineup) %>%
  mutate(lineup_pts=sum(pts_pred)) %>%
  group_by(lineup, position) %>%
  mutate(n=n()) %>%
  select(lineup, position, n, lineup_pts) %>%
  distinct() %>%
  spread(key=position, value=n) %>%
  filter(RB>=2, TE>=1, WR>=3) %>%
  mutate(flex=case_when(RB==3 ~ 'RB',
                        TE==2 ~ 'TE',
                        WR==4 ~ 'WR')) %>%
  group_by(flex) %>%
  dplyr::summarize(pts=median(lineup_pts),
                   cases=n()) %>%
  knitr::kable() %>%
kable_styling(full_width = FALSE)| flex | pts | cases |
|---|---|---|
| RB | 152.2400 | 3113 |
| TE | 152.6066 | 1410 |
| WR | 152.5542 | 5477 |
Pretty even flex configurations, with WRs being the most popular RB’s the second, and TE’s a distance third
Pareto Lineups
lu_df <- sim_lu %>%
  group_by(lineup) %>%
  dplyr::summarize(lineup_pts=sum(pts_pred),
                   lineup_sd=sum(sd_pts)) %>%
  ungroup()

pto <- psel(lu_df, low(lineup_sd) * high(lineup_pts))


ggplot(lu_df, aes(y=lineup_pts, x=lineup_sd)) +
  geom_point() +
  geom_point(data=pto, size=5) +
  ylab('Lineup Points') +
  xlab('Lineup Points St Dev') +
  ggtitle('Lineup Points vs Uncertainty',
          subtitle = 'Pareto Lineups Bolded')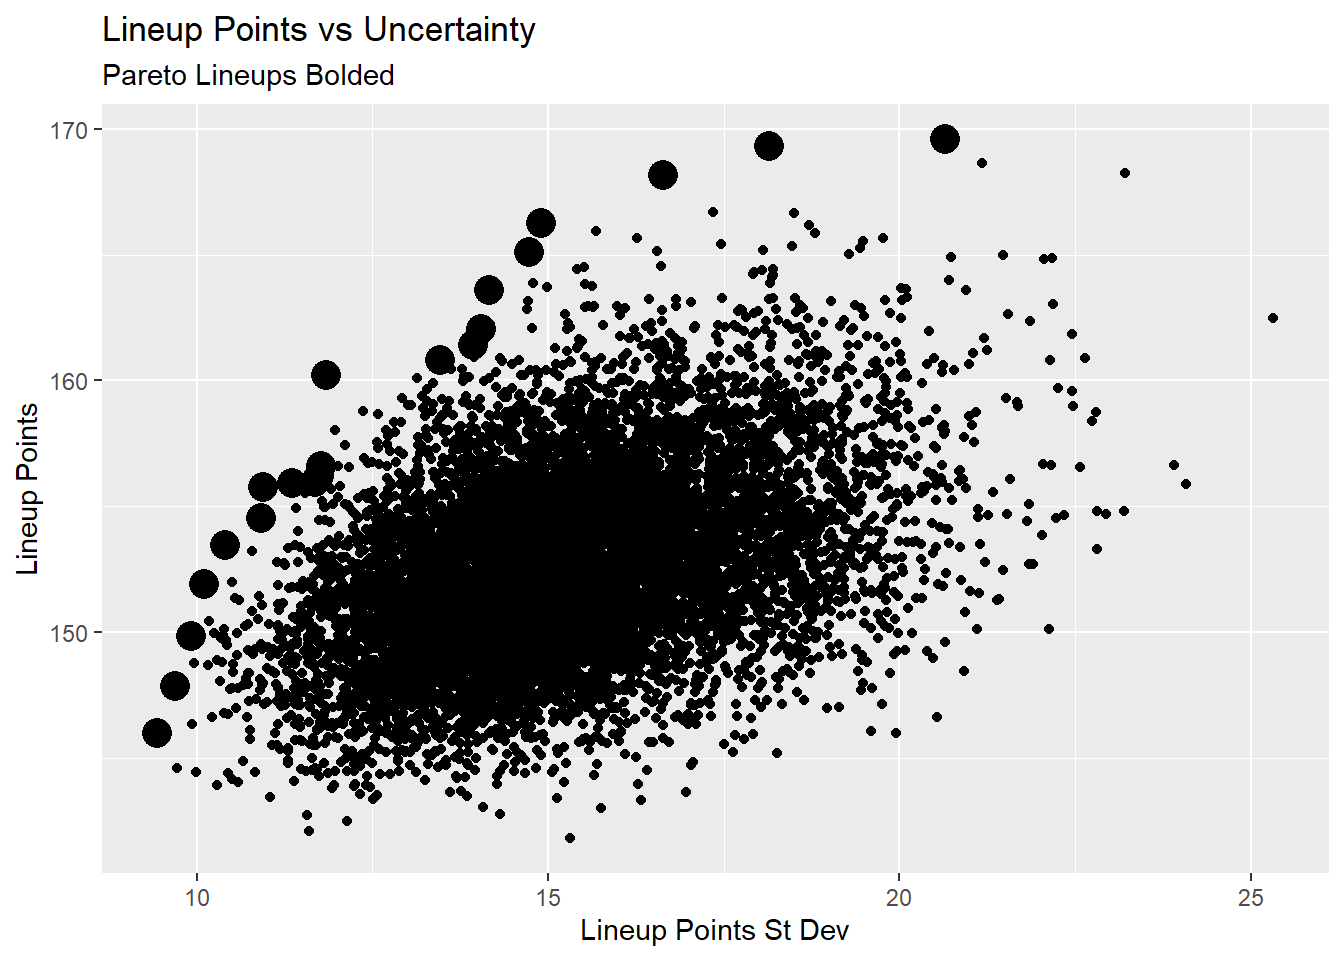
Here’s a look at the pareto lineups.
psel(lu_df, low(lineup_sd) * high(lineup_pts)) %>%
  left_join(sim_lu, by='lineup') %>%
  group_by(lineup) %>%
  arrange(lineup_pts, position, desc(Salary)) %>%
  select(lineup, lineup_pts, lineup_sd, Name, team, position, pts_pred, sd_pts, Salary) %>%
  mutate_at(vars(lineup_pts, lineup_sd, pts_pred, sd_pts), function(x) round(x, 2)) %>%
  knitr::kable() %>%
  kable_styling(fixed_thead = T) %>%
  column_spec(1:3, bold=TRUE) %>%
  collapse_rows(columns = 1:3, valign = 'top') %>%
scroll_box(height = '500px', width = '100%')| lineup | lineup_pts | lineup_sd | Name | team | position | pts_pred | sd_pts | Salary |
|---|---|---|---|---|---|---|---|---|
| 5220 | 146.00 | 9.44 | Panthers | CAR | DST | 9.14 | 1.34 | 2400 |
| Russell Wilson | SEA | QB | 24.67 | 1.06 | 7200 | |||
| Christian McCaffrey | CAR | RB | 24.83 | 1.39 | 9200 | |||
| Devonta Freeman | ATL | RB | 15.74 | 0.73 | 5500 | |||
| Jonnu Smith | TEN | TE | 8.33 | 0.91 | 2800 | |||
| DeAndre Hopkins | HOU | WR | 21.76 | 0.89 | 8100 | |||
| Courtland Sutton | DEN | WR | 15.67 | 0.61 | 5300 | |||
| Kenny Stills | HOU | WR | 13.43 | 1.63 | 4700 | |||
| Dede Westbrook | JAC | WR | 12.43 | 0.88 | 4500 | |||
| 9579 | 147.88 | 9.69 | Giants | NYG | DST | 7.86 | 0.90 | 2200 |
| Russell Wilson | SEA | QB | 24.47 | 1.06 | 7200 | |||
| Le’Veon Bell | NYJ | RB | 18.86 | 1.83 | 6900 | |||
| Devonta Freeman | ATL | RB | 15.71 | 0.73 | 5500 | |||
| Duke Johnson | HOU | RB | 11.00 | 0.66 | 3800 | |||
| Darren Waller | OAK | TE | 16.60 | 1.73 | 5900 | |||
| DeAndre Hopkins | HOU | WR | 20.96 | 0.89 | 8100 | |||
| Courtland Sutton | DEN | WR | 15.25 | 0.61 | 5300 | |||
| Tyler Boyd | CIN | WR | 17.18 | 1.27 | 5100 | |||
| 9197 | 149.87 | 9.91 | Bengals | CIN | DST | 7.03 | 0.60 | 1700 |
| Deshaun Watson | HOU | QB | 25.75 | 1.21 | 7100 | |||
| Chris Carson | SEA | RB | 18.79 | 1.47 | 7000 | |||
| Devonta Freeman | ATL | RB | 15.54 | 0.73 | 5500 | |||
| Hunter Henry | LAC | TE | 14.23 | 1.39 | 4900 | |||
| DeAndre Hopkins | HOU | WR | 22.21 | 0.89 | 8100 | |||
| Chris Godwin | TBB | WR | 19.67 | 1.59 | 7100 | |||
| Courtland Sutton | DEN | WR | 15.36 | 0.61 | 5300 | |||
| Demaryius Thomas | NYJ | WR | 11.29 | 1.44 | 3300 | |||
| 2909 | 151.93 | 10.10 | Raiders | OAK | DST | 7.27 | 0.88 | 1500 |
| Deshaun Watson | HOU | QB | 26.44 | 1.21 | 7100 | |||
| Todd Gurley | LAR | RB | 20.71 | 1.65 | 7400 | |||
| Derrick Henry | TEN | RB | 17.32 | 1.65 | 6000 | |||
| Devonta Freeman | ATL | RB | 15.42 | 0.73 | 5500 | |||
| Evan Engram | NYG | TE | 15.41 | 1.08 | 5300 | |||
| DeAndre Hopkins | HOU | WR | 22.27 | 0.89 | 8100 | |||
| Courtland Sutton | DEN | WR | 15.05 | 0.61 | 5300 | |||
| Ted Ginn Jr. | NOS | WR | 12.05 | 1.41 | 3700 | |||
| 4790 | 153.49 | 10.40 | Panthers | CAR | DST | 9.02 | 1.34 | 2400 |
| Russell Wilson | SEA | QB | 24.46 | 1.06 | 7200 | |||
| Chris Carson | SEA | RB | 19.32 | 1.47 | 7000 | |||
| Nick Chubb | CLE | RB | 19.83 | 1.73 | 6600 | |||
| Devonta Freeman | ATL | RB | 15.46 | 0.73 | 5500 | |||
| Cameron Brate | TBB | TE | 11.21 | 1.30 | 2700 | |||
| DeAndre Hopkins | HOU | WR | 22.25 | 0.89 | 8100 | |||
| Courtland Sutton | DEN | WR | 15.51 | 0.61 | 5300 | |||
| Tyler Boyd | CIN | WR | 16.43 | 1.27 | 5100 | |||
| 6228 | 154.54 | 10.92 | Jaguars | JAC | DST | 12.56 | 1.80 | 2900 |
| Deshaun Watson | HOU | QB | 25.13 | 1.21 | 7100 | |||
| Chris Carson | SEA | RB | 20.93 | 1.47 | 7000 | |||
| Derrick Henry | TEN | RB | 17.53 | 1.65 | 6000 | |||
| Devonta Freeman | ATL | RB | 15.19 | 0.73 | 5500 | |||
| Cameron Brate | TBB | TE | 10.72 | 1.30 | 2700 | |||
| DeAndre Hopkins | HOU | WR | 21.41 | 0.89 | 8100 | |||
| Courtland Sutton | DEN | WR | 15.42 | 0.61 | 5300 | |||
| Tyler Boyd | CIN | WR | 15.65 | 1.27 | 5100 | |||
| 9167 | 155.75 | 10.95 | Raiders | OAK | DST | 6.35 | 0.88 | 1500 |
| Deshaun Watson | HOU | QB | 25.24 | 1.21 | 7100 | |||
| Chris Carson | SEA | RB | 19.72 | 1.47 | 7000 | |||
| Le’Veon Bell | NYJ | RB | 22.29 | 1.83 | 6900 | |||
| Devonta Freeman | ATL | RB | 16.59 | 0.73 | 5500 | |||
| Cameron Brate | TBB | TE | 9.94 | 1.30 | 2700 | |||
| DeAndre Hopkins | HOU | WR | 22.82 | 0.89 | 8100 | |||
| John Brown | BUF | WR | 17.40 | 2.04 | 5900 | |||
| Courtland Sutton | DEN | WR | 15.40 | 0.61 | 5300 | |||
| 6298 | 155.92 | 11.36 | Buccaneers | TBB | DST | 8.29 | 0.80 | 2500 |
| Russell Wilson | SEA | QB | 23.02 | 1.06 | 7200 | |||
| Leonard Fournette | JAC | RB | 24.96 | 2.16 | 7800 | |||
| Devonta Freeman | ATL | RB | 16.38 | 0.73 | 5500 | |||
| Cameron Brate | TBB | TE | 9.15 | 1.30 | 2700 | |||
| DeAndre Hopkins | HOU | WR | 21.84 | 0.89 | 8100 | |||
| Tyler Lockett | SEA | WR | 20.81 | 1.13 | 7000 | |||
| Tyler Boyd | CIN | WR | 16.25 | 1.27 | 5100 | |||
| Mike Williams | LAC | WR | 15.21 | 2.02 | 4000 | |||
| 4471 | 155.97 | 11.68 | Buccaneers | TBB | DST | 8.34 | 0.80 | 2500 |
| Deshaun Watson | HOU | QB | 24.52 | 1.21 | 7100 | |||
| Christian McCaffrey | CAR | RB | 23.60 | 1.39 | 9200 | |||
| Le’Veon Bell | NYJ | RB | 21.57 | 1.83 | 6900 | |||
| Devonta Freeman | ATL | RB | 15.91 | 0.73 | 5500 | |||
| Cameron Brate | TBB | TE | 10.94 | 1.30 | 2700 | |||
| Tyler Lockett | SEA | WR | 18.67 | 1.13 | 7000 | |||
| Tyler Boyd | CIN | WR | 18.22 | 1.27 | 5100 | |||
| Mike Williams | LAC | WR | 14.18 | 2.02 | 4000 | |||
| 9353 | 156.19 | 11.75 | Raiders | OAK | DST | 7.03 | 0.88 | 1500 |
| Deshaun Watson | HOU | QB | 24.93 | 1.21 | 7100 | |||
| Christian McCaffrey | CAR | RB | 25.09 | 1.39 | 9200 | |||
| Austin Ekeler | LAC | RB | 17.76 | 1.63 | 5900 | |||
| Devonta Freeman | ATL | RB | 16.63 | 0.73 | 5500 | |||
| Austin Hooper | ATL | TE | 20.89 | 2.40 | 5500 | |||
| Courtland Sutton | DEN | WR | 15.39 | 0.61 | 5300 | |||
| Tyler Boyd | CIN | WR | 14.55 | 1.27 | 5100 | |||
| Kenny Stills | HOU | WR | 13.92 | 1.63 | 4700 | |||
| 9008 | 156.59 | 11.77 | Raiders | OAK | DST | 5.94 | 0.88 | 1500 |
| Deshaun Watson | HOU | QB | 25.71 | 1.21 | 7100 | |||
| Chris Carson | SEA | RB | 20.42 | 1.47 | 7000 | |||
| Sony Michel | NEP | RB | 16.31 | 1.27 | 5200 | |||
| Jonnu Smith | TEN | TE | 8.56 | 0.91 | 2800 | |||
| DeAndre Hopkins | HOU | WR | 22.52 | 0.89 | 8100 | |||
| Chris Godwin | TBB | WR | 21.22 | 1.59 | 7100 | |||
| T.Y. Hilton | IND | WR | 19.88 | 1.93 | 6100 | |||
| Kenny Stills | HOU | WR | 16.03 | 1.63 | 4700 | |||
| 7263 | 160.20 | 11.85 | Panthers | CAR | DST | 9.53 | 1.34 | 2400 |
| Deshaun Watson | HOU | QB | 24.92 | 1.21 | 7100 | |||
| Le’Veon Bell | NYJ | RB | 18.96 | 1.83 | 6900 | |||
| Devonta Freeman | ATL | RB | 16.26 | 0.73 | 5500 | |||
| Austin Hooper | ATL | TE | 22.78 | 2.40 | 5500 | |||
| Jonnu Smith | TEN | TE | 9.95 | 0.91 | 2800 | |||
| DeAndre Hopkins | HOU | WR | 21.63 | 0.89 | 8100 | |||
| Kenny Golladay | DET | WR | 21.04 | 1.93 | 6400 | |||
| Courtland Sutton | DEN | WR | 15.13 | 0.61 | 5300 | |||
| 2598 | 160.81 | 13.47 | Jaguars | JAC | DST | 11.37 | 1.80 | 2900 |
| Deshaun Watson | HOU | QB | 26.77 | 1.21 | 7100 | |||
| Le’Veon Bell | NYJ | RB | 21.34 | 1.83 | 6900 | |||
| James White | NEP | RB | 15.47 | 1.25 | 5100 | |||
| Cameron Brate | TBB | TE | 9.57 | 1.30 | 2700 | |||
| DeAndre Hopkins | HOU | WR | 21.76 | 0.89 | 8100 | |||
| Michael Thomas | NOS | WR | 24.62 | 2.67 | 8000 | |||
| Kenny Stills | HOU | WR | 16.74 | 1.63 | 4700 | |||
| Dede Westbrook | JAC | WR | 13.15 | 0.88 | 4500 | |||
| 9407 | 161.40 | 13.93 | Raiders | OAK | DST | 7.41 | 0.88 | 1500 |
| Deshaun Watson | HOU | QB | 24.16 | 1.21 | 7100 | |||
| Leonard Fournette | JAC | RB | 25.11 | 2.16 | 7800 | |||
| Le’Veon Bell | NYJ | RB | 22.22 | 1.83 | 6900 | |||
| Derrick Henry | TEN | RB | 18.22 | 1.65 | 6000 | |||
| Cameron Brate | TBB | TE | 9.94 | 1.30 | 2700 | |||
| Michael Thomas | NOS | WR | 26.03 | 2.67 | 8000 | |||
| Courtland Sutton | DEN | WR | 14.53 | 0.61 | 5300 | |||
| Kenny Stills | HOU | WR | 13.79 | 1.63 | 4700 | |||
| 1293 | 162.03 | 14.04 | Panthers | CAR | DST | 8.32 | 1.34 | 2400 |
| Russell Wilson | SEA | QB | 24.75 | 1.06 | 7200 | |||
| Devonta Freeman | ATL | RB | 15.60 | 0.73 | 5500 | |||
| Ty Johnson | DET | RB | 15.89 | 1.54 | 4900 | |||
| Hunter Henry | LAC | TE | 13.90 | 1.39 | 4900 | |||
| Michael Thomas | NOS | WR | 27.13 | 2.67 | 8000 | |||
| Julio Jones | ATL | WR | 22.27 | 1.94 | 7700 | |||
| T.Y. Hilton | IND | WR | 22.29 | 1.93 | 6100 | |||
| Demaryius Thomas | NYJ | WR | 11.89 | 1.44 | 3300 | |||
| 4308 | 163.59 | 14.17 | Panthers | CAR | DST | 9.10 | 1.34 | 2400 |
| Deshaun Watson | HOU | QB | 24.73 | 1.21 | 7100 | |||
| Leonard Fournette | JAC | RB | 24.40 | 2.16 | 7800 | |||
| Devonta Freeman | ATL | RB | 16.32 | 0.73 | 5500 | |||
| Austin Hooper | ATL | TE | 21.80 | 2.40 | 5500 | |||
| Josh Hill | NOS | TE | 9.74 | 1.78 | 3200 | |||
| Michael Thomas | NOS | WR | 26.96 | 2.67 | 8000 | |||
| Courtland Sutton | DEN | WR | 15.12 | 0.61 | 5300 | |||
| Tyler Boyd | CIN | WR | 15.43 | 1.27 | 5100 | |||
| 4540 | 165.11 | 14.73 | Raiders | OAK | DST | 5.69 | 0.88 | 1500 |
| Deshaun Watson | HOU | QB | 24.04 | 1.21 | 7100 | |||
| Leonard Fournette | JAC | RB | 27.03 | 2.16 | 7800 | |||
| Devonta Freeman | ATL | RB | 17.41 | 0.73 | 5500 | |||
| Darren Waller | OAK | TE | 18.11 | 1.73 | 5900 | |||
| Michael Thomas | NOS | WR | 26.46 | 2.67 | 8000 | |||
| Kenny Golladay | DET | WR | 20.33 | 1.93 | 6400 | |||
| Mike Williams | LAC | WR | 14.00 | 2.02 | 4000 | |||
| Ted Ginn Jr. | NOS | WR | 12.05 | 1.41 | 3700 | |||
| 4734 | 166.24 | 14.91 | Raiders | OAK | DST | 7.24 | 0.88 | 1500 |
| Deshaun Watson | HOU | QB | 24.08 | 1.21 | 7100 | |||
| Leonard Fournette | JAC | RB | 23.03 | 2.16 | 7800 | |||
| Chris Carson | SEA | RB | 21.65 | 1.47 | 7000 | |||
| Austin Hooper | ATL | TE | 20.68 | 2.40 | 5500 | |||
| Jonnu Smith | TEN | TE | 9.50 | 0.91 | 2800 | |||
| Julio Jones | ATL | WR | 24.88 | 1.94 | 7700 | |||
| Kenny Golladay | DET | WR | 19.64 | 1.93 | 6400 | |||
| Mike Williams | LAC | WR | 15.53 | 2.02 | 4000 | |||
| 2597 | 168.16 | 16.63 | Raiders | OAK | DST | 6.25 | 0.88 | 1500 |
| Deshaun Watson | HOU | QB | 25.27 | 1.21 | 7100 | |||
| Saquon Barkley | NYG | RB | 25.66 | 2.44 | 8900 | |||
| Le’Veon Bell | NYJ | RB | 22.53 | 1.83 | 6900 | |||
| Austin Hooper | ATL | TE | 19.34 | 2.40 | 5500 | |||
| Cameron Brate | TBB | TE | 8.97 | 1.30 | 2700 | |||
| Michael Thomas | NOS | WR | 26.96 | 2.67 | 8000 | |||
| T.Y. Hilton | IND | WR | 22.58 | 1.93 | 6100 | |||
| DaeSean Hamilton | DEN | WR | 10.59 | 1.97 | 3300 | |||
| 2454 | 169.32 | 18.14 | Jaguars | JAC | DST | 11.52 | 1.80 | 2900 |
| Deshaun Watson | HOU | QB | 25.49 | 1.21 | 7100 | |||
| Leonard Fournette | JAC | RB | 22.71 | 2.16 | 7800 | |||
| Devonta Freeman | ATL | RB | 16.70 | 0.73 | 5500 | |||
| Austin Hooper | ATL | TE | 21.23 | 2.40 | 5500 | |||
| Michael Thomas | NOS | WR | 26.07 | 2.67 | 8000 | |||
| Jarvis Landry | CLE | WR | 14.36 | 2.18 | 4800 | |||
| Kenny Stills | HOU | WR | 14.93 | 1.63 | 4700 | |||
| Alex Erickson | CIN | WR | 16.31 | 3.36 | 3700 | |||
| 2749 | 169.58 | 20.65 | Panthers | CAR | DST | 8.93 | 1.34 | 2400 |
| Sam Darnold | NYJ | QB | 21.14 | 3.57 | 5500 | |||
| Le’Veon Bell | NYJ | RB | 21.34 | 1.83 | 6900 | |||
| Devonta Freeman | ATL | RB | 15.73 | 0.73 | 5500 | |||
| Austin Hooper | ATL | TE | 18.96 | 2.40 | 5500 | |||
| Michael Thomas | NOS | WR | 27.96 | 2.67 | 8000 | |||
| Keenan Allen | LAC | WR | 23.02 | 4.21 | 6400 | |||
| T.Y. Hilton | IND | WR | 19.88 | 1.93 | 6100 | |||
| DaeSean Hamilton | DEN | WR | 12.60 | 1.97 | 3300 |
Week 8 optimal lineups can be found here
