
Week 9 DraftKings Optimal Lineups
We are BACK with optimal lineups from week 9 simulations!
Solid week last week, I broke about even, Kenny Golladay finally put on a show, and I think I’m about to manually exclude Tyler Boyd from being placed in lineups.
No changes again, mainly due to work (that, you know, I get paid for), and working on Big Data Bowl, but I have been diving deep into modeling distributions, which I think can be a big help here.
(P.S. Sorry for all the spelling errors last week, yikes)
If you want to review the overall code for scraping and optimizing projections, the initial post is here.
Setup
library(data.table)
library(dtplyr)
library(tidyverse)
library(rPref)
library(kableExtra)

week <- 9

proj <- readRDS(paste0('week_', week, '_proj.RDS'))

sal <- read_csv(paste0('DKSalaries_wk_', week, '.csv'))
I’ll start with the optimized lineups pulled for week 4, with the same details as last time: 10,000 lineups, using the standard deviation of projections, completely individually based (still working on that).
sim_lu <- readRDS(paste0('sim_lineups_week_', week, '.RDS')) %>%
  rename(pts_base=points) %>%
  select(lineup, Name, team, position, pts_base, pts_pred, sd_pts, Salary)

glimpse(sim_lu)
## Observations: 90,000
## Variables: 8
## Groups: Name [151]
## $ lineup <int> 1, 1, 1, 1, 1, 1, 1, 1, 1, 2, 2, 2, 2, 2, 2, 2, 2, 2,...
## $ Name <chr> "Panthers", "Demaryius Thomas", "Keenan Allen", "Darr...
## $ team <chr> "CAR", "NYJ", "LAC", "OAK", "PHI", "ARI", "LAC", "TBB...
## $ position <chr> "DST", "WR", "WR", "TE", "QB", "RB", "TE", "WR", "RB"...
## $ pts_base <dbl> 8.776187, 9.556592, 16.401666, 15.610270, 18.016345, ...
## $ pts_pred <dbl> 8.631199, 12.272273, 17.432967, 19.602710, 19.975860,...
## $ sd_pts <dbl> 0.9123280, 2.2259666, 1.7393016, 2.4085707, 1.1623662...
## $ Salary <dbl> 2800, 4000, 6400, 6300, 5700, 4500, 6000, 7300, 7000,...sim_lu %>%
filter(lineup<=3) %>%
arrange(lineup, position, desc(pts_pred)) %>%
mutate_at(vars(pts_base, pts_pred, sd_pts), function(x) round(x, 2)) %>%
knitr::kable() %>%
kable_styling() %>%
column_spec(1, bold=TRUE) %>%
collapse_rows(columns = 1, valign = 'top') %>%
scroll_box(height = '600px', width = '100%')| lineup | Name | team | position | pts_base | pts_pred | sd_pts | Salary |
|---|---|---|---|---|---|---|---|
| 1 | Panthers | CAR | DST | 8.78 | 8.63 | 0.91 | 2800 |
| Carson Wentz | PHI | QB | 18.02 | 19.98 | 1.16 | 5700 | |
| Aaron Jones | GBP | RB | 17.69 | 18.70 | 1.18 | 7000 | |
| Kenyan Drake | ARI | RB | 10.46 | 13.65 | 1.33 | 4500 | |
| Darren Waller | OAK | TE | 15.61 | 19.60 | 2.41 | 6300 | |
| Hunter Henry | LAC | TE | 13.70 | 18.31 | 2.46 | 6000 | |
| Chris Godwin | TBB | WR | 17.66 | 19.39 | 1.78 | 7300 | |
| Keenan Allen | LAC | WR | 16.40 | 17.43 | 1.74 | 6400 | |
| Demaryius Thomas | NYJ | WR | 9.56 | 12.27 | 2.23 | 4000 | |
| 2 | Redskins | WAS | DST | 6.34 | 6.75 | 0.80 | 1800 |
| Russell Wilson | SEA | QB | 23.84 | 25.00 | 1.35 | 7100 | |
| Austin Ekeler | LAC | RB | 14.87 | 15.70 | 0.97 | 6000 | |
| Tra Carson | DET | RB | 6.22 | 9.72 | 3.49 | 3300 | |
| Darren Waller | OAK | TE | 15.61 | 16.55 | 2.41 | 6300 | |
| Chris Godwin | TBB | WR | 17.66 | 22.21 | 1.78 | 7300 | |
| Tyler Lockett | SEA | WR | 17.51 | 19.44 | 1.11 | 7500 | |
| T.Y. Hilton | IND | WR | 15.53 | 17.70 | 2.05 | 6500 | |
| Preston Williams | MIA | WR | 10.10 | 13.22 | 2.50 | 4200 | |
| 3 | Redskins | WAS | DST | 6.34 | 6.26 | 0.80 | 1800 |
| Matt Moore | KCC | QB | 15.15 | 22.05 | 4.34 | 4800 | |
| Christian McCaffrey | CAR | RB | 24.20 | 28.39 | 2.88 | 10000 | |
| Aaron Jones | GBP | RB | 17.69 | 18.36 | 1.18 | 7000 | |
| Damien Williams | KCC | RB | 8.92 | 12.46 | 1.94 | 4000 | |
| Darren Waller | OAK | TE | 15.61 | 18.05 | 2.41 | 6300 | |
| Keenan Allen | LAC | WR | 16.40 | 17.22 | 1.74 | 6400 | |
| Jamison Crowder | NYJ | WR | 11.13 | 14.36 | 2.09 | 5300 | |
| Curtis Samuel | CAR | WR | 10.64 | 11.54 | 2.09 | 4300 |
Who is in Optimal Lineups?
sim_lu %>%
  group_by(Name, position, Salary) %>%
  dplyr::summarize(lu=n_distinct(lineup)) %>%
  ungroup() %>%
  group_by(position) %>%
  top_n(10, lu) %>%
  ungroup() %>%
  arrange(position, desc(lu)) %>%
  mutate(Name=factor(Name),
         Name=fct_reorder(Name, lu)) %>%
  ggplot(aes(x=Name, y=lu/1000, fill=Salary)) +
  geom_bar(stat='identity') +
  facet_wrap(~position, ncol = 3, scales='free') +
  coord_flip() +
  scale_y_continuous(labels = scales::comma) +
  scale_fill_viridis_c() +
  xlab('') +
  ylab('Lineups (Thousands)') +
ggtitle('Top 10 Players Present by Position') 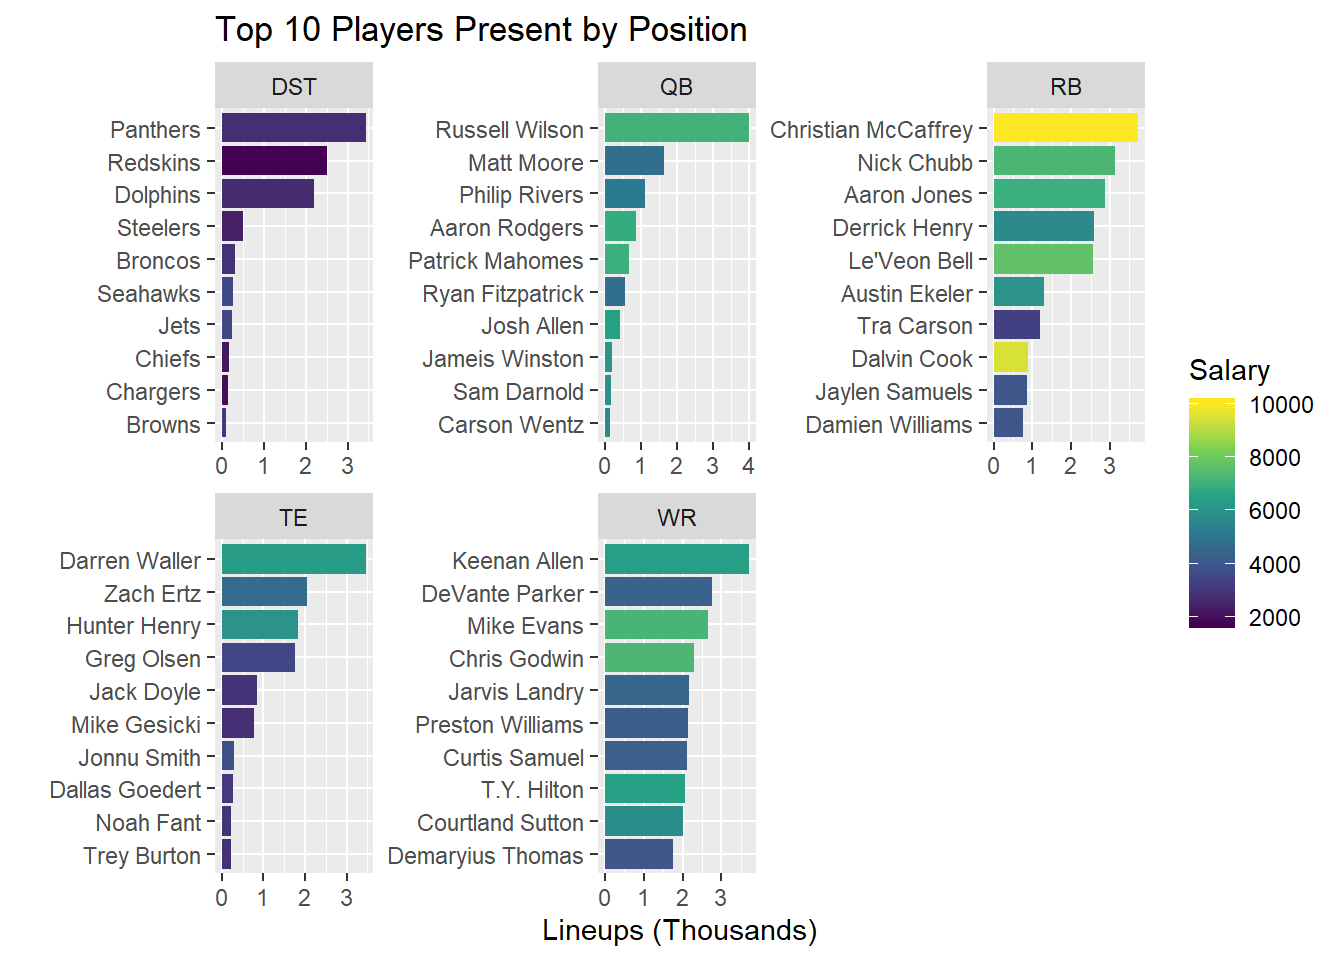
Some of my observations:
Interesting week this week, given the uncertainty around the Chiefs QB Situation. Also, most weeks the model hammers DeShaun Watson and Lamar Jackson, and neither are on the main slate. This week we’re hammering a lot of Russell Wilson. The ‘buy low’ options at QB are Philip Rivers and Ryan Fitzpatrick
Lots of interchangability at the top of the RB pool, with McCaffrey, Chubb, Jones, Henry, and Bell all making string appearances.
Keenan Allen showing up a lot at WR, hopefully he breaks out, as he’s tweeted. Both Bucs WRs showing up as well. Model doesn’t have us really paying up for WR this week
It’s the usual story at TE, there are only a few worth playing, but less segmented than usual, with Doyle and Gesicki bridging the gap.
Pathers, Redskins, and Dolphins at D again. As with most weeks, the model has selected the Defenses with the lowest prices.
Who is getting placed in Lineups?
DraftKings provides scoring for 355 players this week, but only 151 make it into optimized lineups. Why is that? To determine, I’ll plot projected points vs salary, colored by whether or not they make it into optimized lineups, and sized by their projection standard deviation
plyr_lu <- sim_lu %>%
  group_by(Name, position) %>%
  dplyr::summarize(lu=n_distinct(lineup)) %>%
  ungroup()

proj %>%
  filter(avg_type=='weighted') %>%
  mutate(Name = ifelse(pos=="DST", last_name, paste(first_name, last_name))) %>%
  inner_join(sal, by=c("Name")) %>%
  select(Name, team, position, points, Salary, sd_pts) %>%
  left_join(plyr_lu, by='Name') %>%
  replace_na(list(lu=0)) %>%
  mutate(lu_bin=ifelse(lu==0, '0 Lineups', '>=1 Lineups'),
         lu_5=cut(lu,5, labels = FALSE)) %>%
  ggplot(aes(x=Salary, y=points, color=lu_bin, size=sd_pts)) +
  geom_point() +
  scale_color_manual(values = c('red', 'blue'), name="") +
  geom_smooth(inherit.aes = FALSE, aes(x=Salary, y=points), method = 'lm', se=FALSE) +
  ylab('Projected Points') +
  xlab('Salary') +
  ggtitle('Who makes it into Optimized Lineups?') +
  scale_x_continuous(labels=scales::dollar)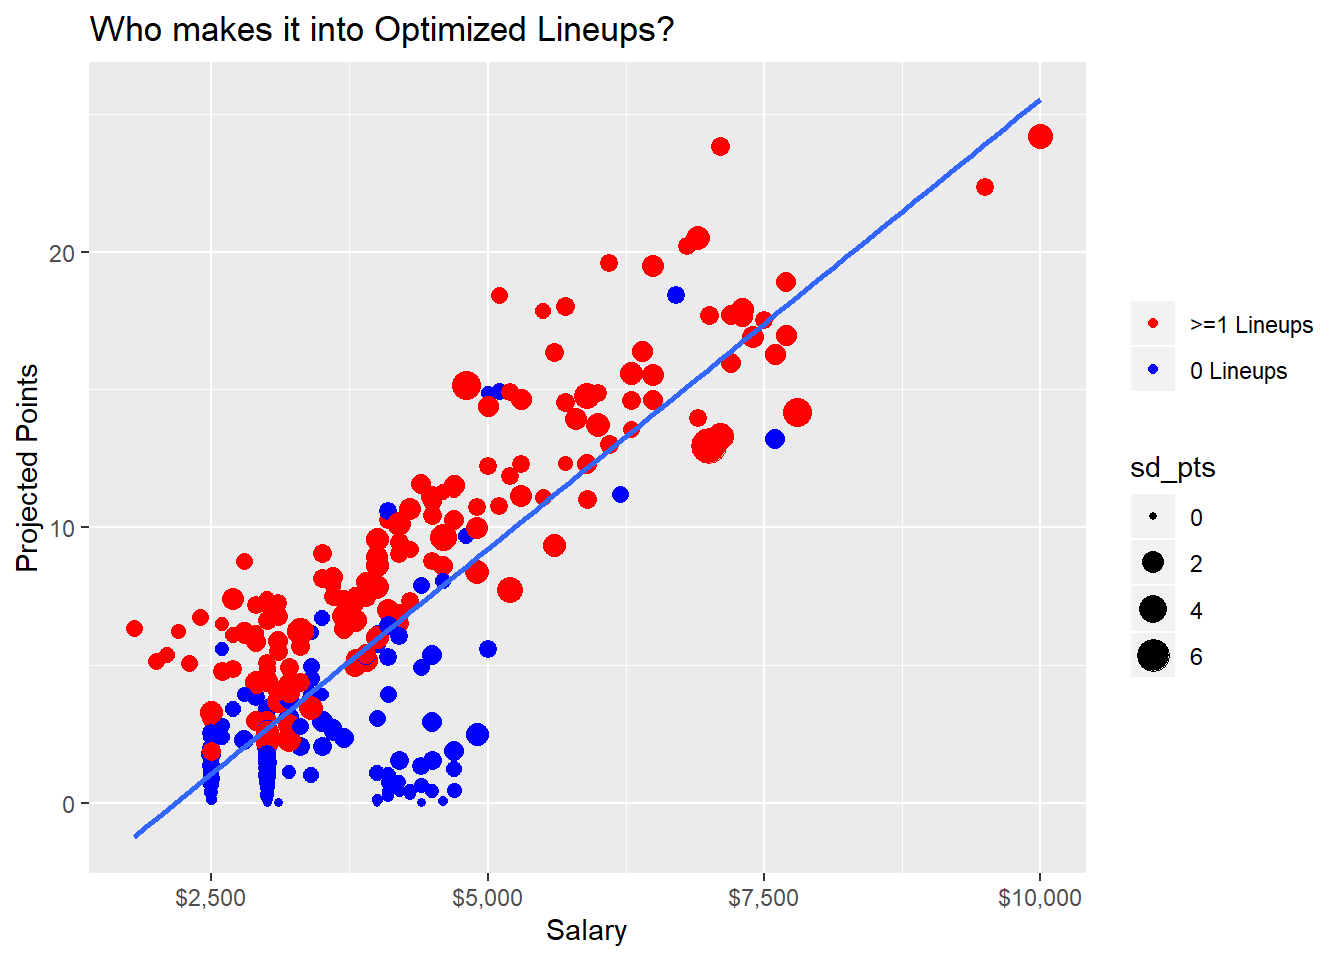
This week, not many players below the line get into lineups, but some above get excluded due to their small uncertainty. Remember, this method takes players who have the potential to blow up rather than players with solid floors.
Flex Configurations
In DFS lineups, you have an extra spot to use on an RB, WR, and TE of your chosing
sim_lu %>%
  group_by(lineup) %>%
  mutate(lineup_pts=sum(pts_pred)) %>%
  group_by(lineup, position) %>%
  mutate(n=n()) %>%
  select(lineup, position, n, lineup_pts) %>%
  distinct() %>%
  spread(key=position, value=n) %>%
  filter(RB>=2, TE>=1, WR>=3) %>%
  mutate(flex=case_when(RB==3 ~ 'RB',
                        TE==2 ~ 'TE',
                        WR==4 ~ 'WR')) %>%
  group_by(flex) %>%
  dplyr::summarize(pts=median(lineup_pts),
                   cases=n()) %>%
  knitr::kable() %>%
kable_styling(full_width = FALSE)| flex | pts | cases |
|---|---|---|
| RB | 147.6162 | 4015 |
| TE | 148.3284 | 2438 |
| WR | 148.0334 | 3547 |
RB’s lead flex configurations, WR’s second, and TE’s third.
Pareto Lineups
lu_df <- sim_lu %>%
  group_by(lineup) %>%
  dplyr::summarize(lineup_pts=sum(pts_pred),
                   lineup_sd=sum(sd_pts)) %>%
  ungroup()

pto <- psel(lu_df, low(lineup_sd) * high(lineup_pts))


ggplot(lu_df, aes(y=lineup_pts, x=lineup_sd)) +
  geom_point() +
  geom_point(data=pto, size=5) +
  ylab('Lineup Points') +
  xlab('Lineup Points St Dev') +
  ggtitle('Lineup Points vs Uncertainty',
          subtitle = 'Pareto Lineups Bolded')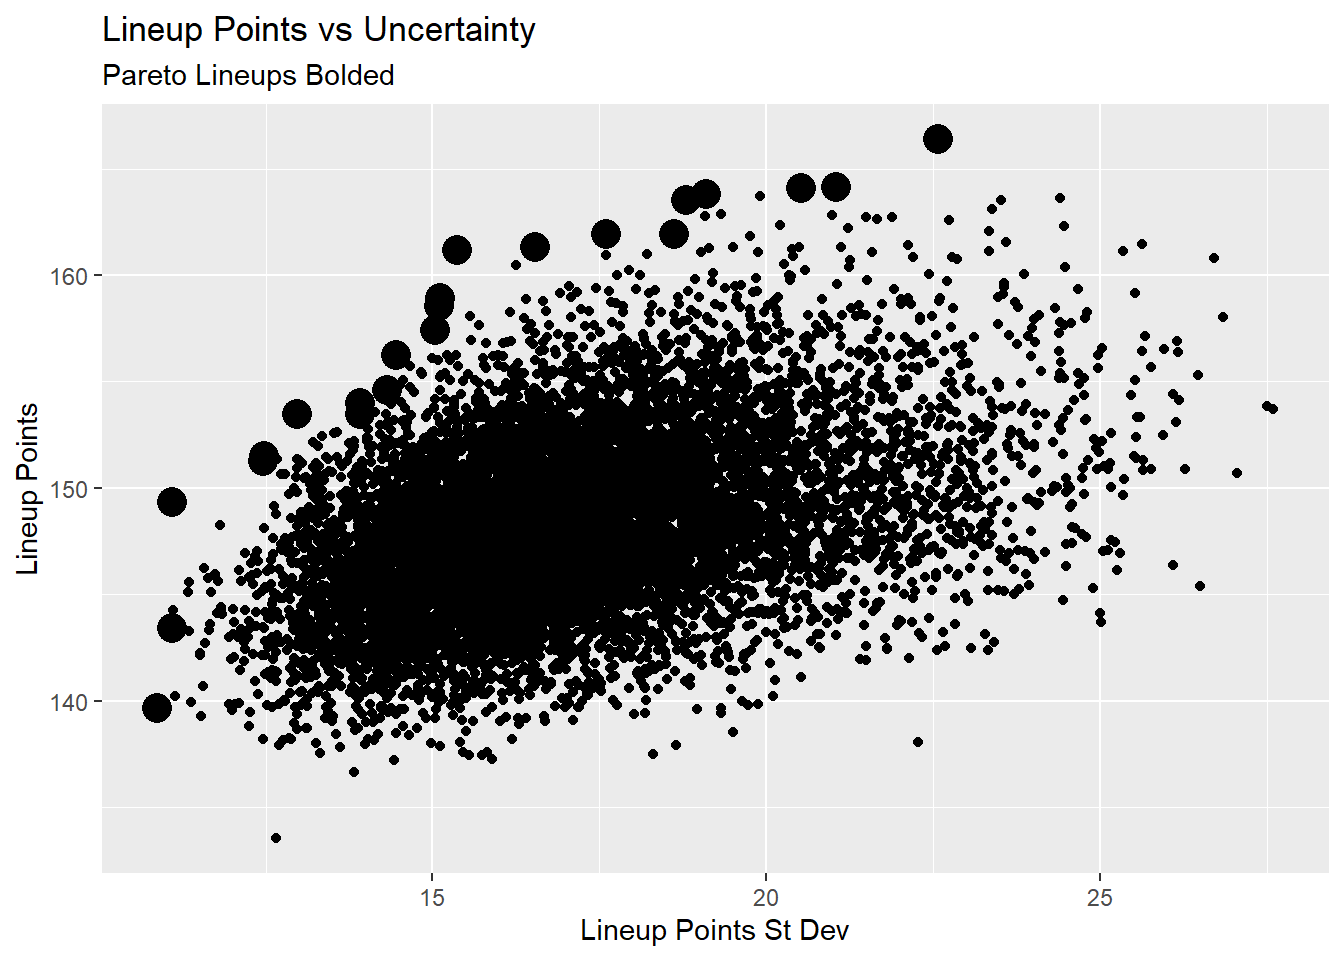
Here’s a look at the pareto lineups.
psel(lu_df, low(lineup_sd) * high(lineup_pts)) %>%
  left_join(sim_lu, by='lineup') %>%
  group_by(lineup) %>%
  arrange(lineup_pts, position, desc(Salary)) %>%
  select(lineup, lineup_pts, lineup_sd, Name, team, position, pts_pred, sd_pts, Salary) %>%
  mutate_at(vars(lineup_pts, lineup_sd, pts_pred, sd_pts), function(x) round(x, 2)) %>%
  knitr::kable() %>%
  kable_styling(fixed_thead = T) %>%
  column_spec(1:3, bold=TRUE) %>%
  collapse_rows(columns = 1:3, valign = 'top') %>%
scroll_box(height = '500px', width = '100%')| lineup | lineup_pts | lineup_sd | Name | team | position | pts_pred | sd_pts | Salary |
|---|---|---|---|---|---|---|---|---|
| 906 | 139.67 | 10.88 | Panthers | CAR | DST | 9.26 | 0.91 | 2800 |
| Russell Wilson | SEA | QB | 23.84 | 1.35 | 7100 | |||
| Aaron Jones | GBP | RB | 18.31 | 1.18 | 7000 | |||
| Austin Ekeler | LAC | RB | 16.62 | 0.97 | 6000 | |||
| Phillip Lindsay | DEN | RB | 13.82 | 1.11 | 5300 | |||
| Greg Olsen | CAR | TE | 11.95 | 1.30 | 3500 | |||
| Mike Evans | TBB | WR | 18.19 | 1.60 | 7200 | |||
| Keenan Allen | LAC | WR | 16.25 | 1.74 | 6400 | |||
| Mike Williams | LAC | WR | 11.43 | 0.72 | 4600 | |||
| 4101 | 143.40 | 11.09 | Panthers | CAR | DST | 9.05 | 0.91 | 2800 |
| Philip Rivers | LAC | QB | 19.97 | 0.83 | 5100 | |||
| Dalvin Cook | MIN | RB | 24.06 | 0.95 | 9500 | |||
| Aaron Jones | GBP | RB | 18.45 | 1.18 | 7000 | |||
| Austin Ekeler | LAC | RB | 16.75 | 0.97 | 6000 | |||
| Greg Olsen | CAR | TE | 9.62 | 1.30 | 3500 | |||
| Kenny Golladay | DET | WR | 19.03 | 1.85 | 7700 | |||
| Curtis Samuel | CAR | WR | 14.29 | 2.09 | 4300 | |||
| Cole Beasley | BUF | WR | 12.17 | 1.01 | 4100 | |||
| 8453 | 149.35 | 11.10 | Panthers | CAR | DST | 10.45 | 0.91 | 2800 |
| Russell Wilson | SEA | QB | 25.99 | 1.35 | 7100 | |||
| Le’Veon Bell | NYJ | RB | 21.40 | 1.53 | 7700 | |||
| Aaron Jones | GBP | RB | 21.11 | 1.18 | 7000 | |||
| Greg Olsen | CAR | TE | 10.48 | 1.30 | 3500 | |||
| JuJu Smith-Schuster | PIT | WR | 17.10 | 1.17 | 6300 | |||
| Courtland Sutton | DEN | WR | 16.63 | 2.00 | 5800 | |||
| Alshon Jeffery | PHI | WR | 13.57 | 1.00 | 5000 | |||
| Danny Amendola | DET | WR | 12.61 | 0.65 | 4700 | |||
| 8217 | 151.25 | 12.46 | Panthers | CAR | DST | 9.82 | 0.91 | 2800 |
| Jameis Winston | TBB | QB | 21.67 | 0.96 | 6100 | |||
| Dalvin Cook | MIN | RB | 23.64 | 0.95 | 9500 | |||
| Devin Singletary | BUF | RB | 13.40 | 1.59 | 4700 | |||
| Kenyan Drake | ARI | RB | 13.19 | 1.33 | 4500 | |||
| Jack Doyle | IND | TE | 9.06 | 1.37 | 3000 | |||
| Mike Evans | TBB | WR | 22.94 | 1.60 | 7200 | |||
| Keenan Allen | LAC | WR | 20.64 | 1.74 | 6400 | |||
| Courtland Sutton | DEN | WR | 16.87 | 2.00 | 5800 | |||
| 6302 | 151.48 | 12.48 | Redskins | WAS | DST | 7.09 | 0.80 | 1800 |
| Russell Wilson | SEA | QB | 26.31 | 1.35 | 7100 | |||
| Le’Veon Bell | NYJ | RB | 19.41 | 1.53 | 7700 | |||
| Aaron Jones | GBP | RB | 19.85 | 1.18 | 7000 | |||
| Zach Ertz | PHI | TE | 14.38 | 1.80 | 4700 | |||
| Greg Olsen | CAR | TE | 10.95 | 1.30 | 3500 | |||
| JuJu Smith-Schuster | PIT | WR | 16.82 | 1.17 | 6300 | |||
| John Brown | BUF | WR | 17.44 | 1.34 | 6100 | |||
| Courtland Sutton | DEN | WR | 19.23 | 2.00 | 5800 | |||
| 8783 | 153.45 | 12.96 | Panthers | CAR | DST | 9.58 | 0.91 | 2800 |
| Russell Wilson | SEA | QB | 26.79 | 1.35 | 7100 | |||
| Aaron Jones | GBP | RB | 19.10 | 1.18 | 7000 | |||
| Austin Ekeler | LAC | RB | 16.02 | 0.97 | 6000 | |||
| Darren Waller | OAK | TE | 22.33 | 2.41 | 6300 | |||
| Keenan Allen | LAC | WR | 17.06 | 1.74 | 6400 | |||
| JuJu Smith-Schuster | PIT | WR | 16.85 | 1.17 | 6300 | |||
| Cole Beasley | BUF | WR | 13.39 | 1.01 | 4100 | |||
| Demaryius Thomas | NYJ | WR | 12.32 | 2.23 | 4000 | |||
| 7100 | 153.46 | 13.91 | Redskins | WAS | DST | 6.94 | 0.80 | 1800 |
| Russell Wilson | SEA | QB | 24.73 | 1.35 | 7100 | |||
| Aaron Jones | GBP | RB | 18.65 | 1.18 | 7000 | |||
| Austin Ekeler | LAC | RB | 16.62 | 0.97 | 6000 | |||
| Hunter Henry | LAC | TE | 19.39 | 2.46 | 6000 | |||
| Zach Ertz | PHI | TE | 14.71 | 1.80 | 4700 | |||
| T.Y. Hilton | IND | WR | 18.60 | 2.05 | 6500 | |||
| Keenan Allen | LAC | WR | 19.30 | 1.74 | 6400 | |||
| DeVante Parker | MIA | WR | 14.50 | 1.56 | 4400 | |||
| 5450 | 153.99 | 13.92 | Panthers | CAR | DST | 9.73 | 0.91 | 2800 |
| Russell Wilson | SEA | QB | 24.39 | 1.35 | 7100 | |||
| Aaron Jones | GBP | RB | 19.48 | 1.18 | 7000 | |||
| Derrick Henry | TEN | RB | 17.98 | 1.34 | 5700 | |||
| Jaylen Samuels | PIT | RB | 13.11 | 2.32 | 4000 | |||
| Darren Waller | OAK | TE | 22.58 | 2.41 | 6300 | |||
| Kenny Golladay | DET | WR | 20.74 | 1.85 | 7700 | |||
| Alshon Jeffery | PHI | WR | 13.68 | 1.00 | 5000 | |||
| DeVante Parker | MIA | WR | 12.31 | 1.56 | 4400 | |||
| 8407 | 154.62 | 14.32 | Dolphins | MIA | DST | 13.79 | 2.07 | 2700 |
| Russell Wilson | SEA | QB | 27.15 | 1.35 | 7100 | |||
| Le’Veon Bell | NYJ | RB | 21.38 | 1.53 | 7700 | |||
| Tarik Cohen | CHI | RB | 11.41 | 1.15 | 4200 | |||
| Darren Waller | OAK | TE | 18.77 | 2.41 | 6300 | |||
| Mike Gesicki | MIA | TE | 9.25 | 1.78 | 2800 | |||
| Chris Godwin | TBB | WR | 20.96 | 1.78 | 7300 | |||
| Mike Evans | TBB | WR | 19.76 | 1.60 | 7200 | |||
| Danny Amendola | DET | WR | 12.15 | 0.65 | 4700 | |||
| 5627 | 156.24 | 14.45 | Dolphins | MIA | DST | 11.11 | 2.07 | 2700 |
| Philip Rivers | LAC | QB | 21.04 | 0.83 | 5100 | |||
| Nick Chubb | CLE | RB | 23.95 | 2.37 | 7300 | |||
| Aaron Jones | GBP | RB | 20.32 | 1.18 | 7000 | |||
| Austin Ekeler | LAC | RB | 15.32 | 0.97 | 6000 | |||
| Greg Olsen | CAR | TE | 10.90 | 1.30 | 3500 | |||
| Mike Evans | TBB | WR | 20.61 | 1.60 | 7200 | |||
| T.Y. Hilton | IND | WR | 19.30 | 2.05 | 6500 | |||
| Jarvis Landry | CLE | WR | 13.70 | 2.08 | 4500 | |||
| 6133 | 157.40 | 15.03 | Redskins | WAS | DST | 7.22 | 0.80 | 1800 |
| Russell Wilson | SEA | QB | 24.67 | 1.35 | 7100 | |||
| Austin Ekeler | LAC | RB | 16.61 | 0.97 | 6000 | |||
| Derrick Henry | TEN | RB | 16.57 | 1.34 | 5700 | |||
| Darren Waller | OAK | TE | 18.99 | 2.41 | 6300 | |||
| Kenny Golladay | DET | WR | 21.64 | 1.85 | 7700 | |||
| Keenan Allen | LAC | WR | 19.24 | 1.74 | 6400 | |||
| Jarvis Landry | CLE | WR | 14.81 | 2.08 | 4500 | |||
| Preston Williams | MIA | WR | 17.63 | 2.50 | 4200 | |||
| 6151 | 158.53 | 15.10 | Redskins | WAS | DST | 7.45 | 0.80 | 1800 |
| Russell Wilson | SEA | QB | 25.72 | 1.35 | 7100 | |||
| Christian McCaffrey | CAR | RB | 26.67 | 2.88 | 10000 | |||
| Austin Ekeler | LAC | RB | 16.59 | 0.97 | 6000 | |||
| Mike Gesicki | MIA | TE | 9.63 | 1.78 | 2800 | |||
| Chris Godwin | TBB | WR | 23.22 | 1.78 | 7300 | |||
| Keenan Allen | LAC | WR | 19.24 | 1.74 | 6400 | |||
| DeVante Parker | MIA | WR | 14.39 | 1.56 | 4400 | |||
| Demaryius Thomas | NYJ | WR | 15.62 | 2.23 | 4000 | |||
| 9884 | 158.94 | 15.12 | Redskins | WAS | DST | 6.12 | 0.80 | 1800 |
| Russell Wilson | SEA | QB | 25.45 | 1.35 | 7100 | |||
| Christian McCaffrey | CAR | RB | 26.53 | 2.88 | 10000 | |||
| David Montgomery | CHI | RB | 14.93 | 1.14 | 5200 | |||
| Darren Waller | OAK | TE | 19.48 | 2.41 | 6300 | |||
| Greg Olsen | CAR | TE | 10.72 | 1.30 | 3500 | |||
| Mike Evans | TBB | WR | 21.12 | 1.60 | 7200 | |||
| Jarvis Landry | CLE | WR | 17.24 | 2.08 | 4500 | |||
| DeVante Parker | MIA | WR | 17.35 | 1.56 | 4400 | |||
| 9807 | 161.19 | 15.37 | Panthers | CAR | DST | 9.76 | 0.91 | 2800 |
| Philip Rivers | LAC | QB | 19.33 | 0.83 | 5100 | |||
| Aaron Jones | GBP | RB | 20.59 | 1.18 | 7000 | |||
| Derrick Henry | TEN | RB | 17.81 | 1.34 | 5700 | |||
| Trey Burton | CHI | TE | 9.44 | 2.28 | 2900 | |||
| Adam Thielen | MIN | WR | 28.03 | 4.49 | 7800 | |||
| Mike Evans | TBB | WR | 21.94 | 1.60 | 7200 | |||
| Keenan Allen | LAC | WR | 20.02 | 1.74 | 6400 | |||
| Alshon Jeffery | PHI | WR | 14.27 | 1.00 | 5000 | |||
| 88 | 161.32 | 16.54 | Redskins | WAS | DST | 6.81 | 0.80 | 1800 |
| Ryan Fitzpatrick | MIA | QB | 21.52 | 2.62 | 4800 | |||
| Christian McCaffrey | CAR | RB | 31.30 | 2.88 | 10000 | |||
| Le’Veon Bell | NYJ | RB | 23.45 | 1.53 | 7700 | |||
| Devin Singletary | BUF | RB | 13.90 | 1.59 | 4700 | |||
| Darren Waller | OAK | TE | 20.81 | 2.41 | 6300 | |||
| Keenan Allen | LAC | WR | 19.05 | 1.74 | 6400 | |||
| DeVante Parker | MIA | WR | 13.25 | 1.56 | 4400 | |||
| Taylor Gabriel | CHI | WR | 11.24 | 1.40 | 3900 | |||
| 7032 | 161.93 | 17.61 | Redskins | WAS | DST | 7.01 | 0.80 | 1800 |
| Matt Moore | KCC | QB | 28.30 | 4.34 | 4800 | |||
| Christian McCaffrey | CAR | RB | 29.33 | 2.88 | 10000 | |||
| Derrick Henry | TEN | RB | 16.23 | 1.34 | 5700 | |||
| Foster Moreau | OAK | TE | 8.61 | 1.23 | 2600 | |||
| Kenny Golladay | DET | WR | 19.60 | 1.85 | 7700 | |||
| Mike Evans | TBB | WR | 21.91 | 1.60 | 7200 | |||
| Courtland Sutton | DEN | WR | 17.02 | 2.00 | 5800 | |||
| DeVante Parker | MIA | WR | 13.91 | 1.56 | 4400 | |||
| 4227 | 161.95 | 18.61 | Dolphins | MIA | DST | 11.09 | 2.07 | 2700 |
| Russell Wilson | SEA | QB | 25.09 | 1.35 | 7100 | |||
| Christian McCaffrey | CAR | RB | 29.73 | 2.88 | 10000 | |||
| Derrick Henry | TEN | RB | 19.02 | 1.34 | 5700 | |||
| Chris Thompson | WAS | RB | 13.02 | 2.59 | 4000 | |||
| Trey Burton | CHI | TE | 11.55 | 2.28 | 2900 | |||
| Tyreek Hill | KCC | WR | 20.38 | 2.12 | 7400 | |||
| Jamison Crowder | NYJ | WR | 17.97 | 2.09 | 5300 | |||
| Sammy Watkins | KCC | WR | 14.10 | 1.89 | 4900 | |||
| 7197 | 163.51 | 18.80 | Panthers | CAR | DST | 8.61 | 0.91 | 2800 |
| Matt Moore | KCC | QB | 23.76 | 4.34 | 4800 | |||
| Nick Chubb | CLE | RB | 23.36 | 2.37 | 7300 | |||
| Derrick Henry | TEN | RB | 17.82 | 1.34 | 5700 | |||
| Darren Waller | OAK | TE | 18.55 | 2.41 | 6300 | |||
| Chris Godwin | TBB | WR | 21.94 | 1.78 | 7300 | |||
| Mike Evans | TBB | WR | 21.19 | 1.60 | 7200 | |||
| DeVante Parker | MIA | WR | 13.03 | 1.56 | 4400 | |||
| Preston Williams | MIA | WR | 15.25 | 2.50 | 4200 | |||
| 4431 | 163.79 | 19.09 | Dolphins | MIA | DST | 11.35 | 2.07 | 2700 |
| Philip Rivers | LAC | QB | 18.80 | 0.83 | 5100 | |||
| Christian McCaffrey | CAR | RB | 33.28 | 2.88 | 10000 | |||
| Mark Walton | MIA | RB | 14.29 | 1.17 | 4500 | |||
| Hunter Henry | LAC | TE | 18.70 | 2.46 | 6000 | |||
| Jack Doyle | IND | TE | 10.69 | 1.37 | 3000 | |||
| Adam Thielen | MIN | WR | 23.78 | 4.49 | 7800 | |||
| Keenan Allen | LAC | WR | 19.30 | 1.74 | 6400 | |||
| Jarvis Landry | CLE | WR | 13.59 | 2.08 | 4500 | |||
| 8993 | 164.11 | 20.51 | Dolphins | MIA | DST | 11.60 | 2.07 | 2700 |
| Russell Wilson | SEA | QB | 25.01 | 1.35 | 7100 | |||
| Christian McCaffrey | CAR | RB | 28.03 | 2.88 | 10000 | |||
| Damien Williams | KCC | RB | 12.98 | 1.94 | 4000 | |||
| Dion Lewis | TEN | RB | 12.14 | 1.97 | 3800 | |||
| Darren Waller | OAK | TE | 20.32 | 2.41 | 6300 | |||
| Davante Adams | GBP | WR | 23.87 | 3.60 | 7100 | |||
| Jarvis Landry | CLE | WR | 15.86 | 2.08 | 4500 | |||
| Demaryius Thomas | NYJ | WR | 14.30 | 2.23 | 4000 | |||
| 5232 | 164.16 | 21.04 | Dolphins | MIA | DST | 11.73 | 2.07 | 2700 |
| Matt Moore | KCC | QB | 21.75 | 4.34 | 4800 | |||
| Christian McCaffrey | CAR | RB | 31.11 | 2.88 | 10000 | |||
| Nick Chubb | CLE | RB | 21.20 | 2.37 | 7300 | |||
| Darren Waller | OAK | TE | 20.07 | 2.41 | 6300 | |||
| Mike Evans | TBB | WR | 21.33 | 1.60 | 7200 | |||
| DeVante Parker | MIA | WR | 14.19 | 1.56 | 4400 | |||
| DaeSean Hamilton | DEN | WR | 13.48 | 2.58 | 3700 | |||
| Nelson Agholor | PHI | WR | 9.30 | 1.24 | 3600 | |||
| 9999 | 166.38 | 22.57 | Panthers | CAR | DST | 10.97 | 0.91 | 2800 |
| Patrick Mahomes | KCC | QB | 32.20 | 7.77 | 7000 | |||
| Christian McCaffrey | CAR | RB | 30.02 | 2.88 | 10000 | |||
| Nick Chubb | CLE | RB | 20.29 | 2.37 | 7300 | |||
| Noah Fant | DEN | TE | 8.59 | 1.17 | 3000 | |||
| Mike Evans | TBB | WR | 22.73 | 1.60 | 7200 | |||
| DeVante Parker | MIA | WR | 13.23 | 1.56 | 4400 | |||
| Curtis Samuel | CAR | WR | 16.03 | 2.09 | 4300 | |||
| Demaryius Thomas | NYJ | WR | 12.33 | 2.23 | 4000 |
Week 9 optimal lineups can be found here
