
Week 10 DraftKings Optimal Lineups
We are BACK with optimal lineups from week 10 simulations!
No changes again, mainly due to work (that, you know, I get paid for),family visiting, and working on Big Data Bowl, but I have been diving deep into modeling distributions, which I think can be a big help here.
If you want to review the overall code for scraping and optimizing projections, the initial post is here.
Setup
library(data.table)
library(dtplyr)
library(tidyverse)
library(rPref)
library(kableExtra)

week <- 10

proj <- readRDS(paste0('week_', week, '_proj.RDS'))

sal <- read_csv(paste0('DKSalaries_wk_', week, '.csv'))
I’ll start with the optimized lineups pulled for week 4, with the same details as last time: 10,000 lineups, using the standard deviation of projections, completely individually based (still working on that).
sim_lu <- readRDS(paste0('sim_lineups_week_', week, '.RDS')) %>%
  rename(pts_base=points) %>%
  select(lineup, Name, team, position, pts_base, pts_pred, sd_pts, Salary)

glimpse(sim_lu)
## Observations: 90,000
## Variables: 8
## Groups: Name [141]
## $ lineup <int> 1, 1, 1, 1, 1, 1, 1, 1, 1, 2, 2, 2, 2, 2, 2, 2, 2, 2,...
## $ Name <chr> "Giants", "Drew Brees", "Golden Tate", "Jack Doyle", ...
## $ team <chr> "NYG", "NOS", "NYG", "IND", "TBB", "ARI", "TEN", "NOS...
## $ position <chr> "DST", "QB", "WR", "TE", "WR", "RB", "RB", "WR", "RB"...
## $ pts_base <dbl> 8.953342, 22.683393, 13.980667, 9.295357, 20.129093, ...
## $ pts_pred <dbl> 9.743596, 24.007102, 15.804292, 9.574533, 21.860245, ...
## $ sd_pts <dbl> 1.7980737, 1.1325725, 1.6731702, 1.1735793, 1.4222901...
## $ Salary <dbl> 2800, 6700, 5900, 3600, 7600, 5700, 6400, 8300, 3000,...sim_lu %>%
filter(lineup<=3) %>%
arrange(lineup, position, desc(pts_pred)) %>%
mutate_at(vars(pts_base, pts_pred, sd_pts), function(x) round(x, 2)) %>%
knitr::kable() %>%
kable_styling() %>%
column_spec(1, bold=TRUE) %>%
collapse_rows(columns = 1, valign = 'top') %>%
scroll_box(height = '600px', width = '100%')| lineup | Name | team | position | pts_base | pts_pred | sd_pts | Salary |
|---|---|---|---|---|---|---|---|
| 1 | Giants | NYG | DST | 8.95 | 9.74 | 1.80 | 2800 |
| Drew Brees | NOS | QB | 22.68 | 24.01 | 1.13 | 6700 | |
| Derrick Henry | TEN | RB | 15.58 | 19.11 | 1.55 | 6400 | |
| David Johnson | ARI | RB | 14.53 | 17.23 | 2.13 | 5700 | |
| Kareem Hunt | CLE | RB | 7.38 | 11.83 | 1.91 | 3000 | |
| Jack Doyle | IND | TE | 9.30 | 9.57 | 1.17 | 3600 | |
| Michael Thomas | NOS | WR | 24.45 | 24.15 | 1.69 | 8300 | |
| Mike Evans | TBB | WR | 20.13 | 21.86 | 1.42 | 7600 | |
| Golden Tate | NYG | WR | 13.98 | 15.80 | 1.67 | 5900 | |
| 2 | Chiefs | KCC | DST | 7.74 | 8.71 | 0.90 | 2700 |
| Lamar Jackson | BAL | QB | 23.76 | 26.82 | 2.99 | 7300 | |
| Devonta Freeman | ATL | RB | 13.42 | 15.40 | 0.94 | 5100 | |
| David Montgomery | CHI | RB | 14.83 | 14.51 | 0.87 | 5300 | |
| Rhett Ellison | NYG | TE | 7.62 | 8.99 | 1.47 | 2500 | |
| Michael Thomas | NOS | WR | 24.45 | 25.57 | 1.69 | 8300 | |
| Mike Evans | TBB | WR | 20.13 | 21.16 | 1.42 | 7600 | |
| Tyreek Hill | KCC | WR | 18.97 | 20.48 | 1.43 | 7700 | |
| Adam Humphries | TEN | WR | 8.42 | 11.59 | 1.21 | 3500 | |
| 3 | Giants | NYG | DST | 8.95 | 11.60 | 1.80 | 2800 |
| Patrick Mahomes | KCC | QB | 22.09 | 24.92 | 2.61 | 7000 | |
| David Johnson | ARI | RB | 14.53 | 16.74 | 2.13 | 5700 | |
| Kareem Hunt | CLE | RB | 7.38 | 9.32 | 1.91 | 3000 | |
| Jack Doyle | IND | TE | 9.30 | 10.52 | 1.17 | 3600 | |
| Michael Thomas | NOS | WR | 24.45 | 25.53 | 1.69 | 8300 | |
| Mike Evans | TBB | WR | 20.13 | 21.96 | 1.42 | 7600 | |
| Chris Godwin | TBB | WR | 18.22 | 20.30 | 1.63 | 7400 | |
| Curtis Samuel | CAR | WR | 11.02 | 12.71 | 1.62 | 4600 |
Who is in Optimal Lineups?
sim_lu %>%
  group_by(Name, position, Salary) %>%
  dplyr::summarize(lu=n_distinct(lineup)) %>%
  ungroup() %>%
  group_by(position) %>%
  top_n(10, lu) %>%
  ungroup() %>%
  arrange(position, desc(lu)) %>%
  mutate(Name=factor(Name),
         Name=fct_reorder(Name, lu)) %>%
  ggplot(aes(x=Name, y=lu/1000, fill=Salary)) +
  geom_bar(stat='identity') +
  facet_wrap(~position, ncol = 3, scales='free') +
  coord_flip() +
  scale_y_continuous(labels = scales::comma) +
  scale_fill_viridis_c() +
  xlab('') +
  ylab('Lineups (Thousands)') +
ggtitle('Top 10 Players Present by Position') 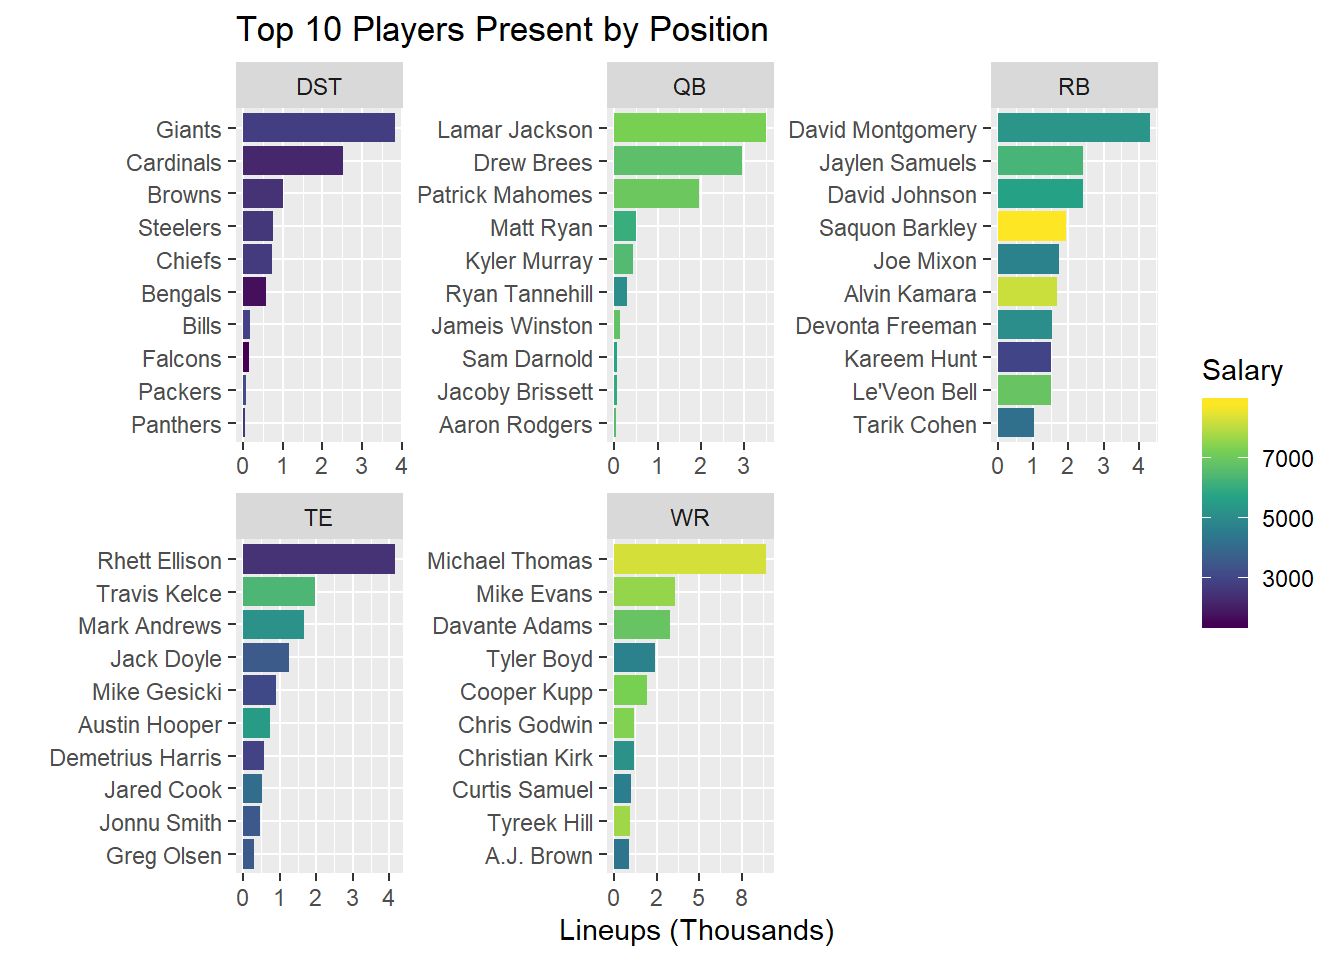
Some of my observations:
A top-heavy week at QB with some familiar faces. Lamar Jackson, Drew Brees, and Patrick Mahomes are the most heavily represented.
David Montgomery is the most represented in the RB pool, but a pretty even field after that. Kareem Hunt looks potentially like the value play.
Michael Thomas shows up in almost 90% of lineups. There appears to be a naturally occuring Brees-Thomas stack this week.
Different week at TE with a heavy favorite. Rhett Ellison is most represented largely due to his low salary.
Giants a favorite on D (mostly because Adam Gase doesn’t do analytics, right!?), followed by the Cardinals, and a few others.
Who is getting placed in Lineups?
DraftKings provides scoring for 349 players this week, but only 141 make it into optimized lineups. Why is that? To determine, I’ll plot projected points vs salary, colored by whether or not they make it into optimized lineups, and sized by their projection standard deviation
plyr_lu <- sim_lu %>%
  group_by(Name, position) %>%
  dplyr::summarize(lu=n_distinct(lineup)) %>%
  ungroup()

proj %>%
  filter(avg_type=='weighted') %>%
  mutate(Name = ifelse(pos=="DST", last_name, paste(first_name, last_name))) %>%
  inner_join(sal, by=c("Name")) %>%
  select(Name, team, position, points, Salary, sd_pts) %>%
  left_join(plyr_lu, by='Name') %>%
  replace_na(list(lu=0)) %>%
  mutate(lu_bin=ifelse(lu==0, '0 Lineups', '>=1 Lineups'),
         lu_5=cut(lu,5, labels = FALSE)) %>%
  ggplot(aes(x=Salary, y=points, color=lu_bin, size=sd_pts)) +
  geom_point() +
  scale_color_manual(values = c('red', 'blue'), name="") +
  geom_smooth(inherit.aes = FALSE, aes(x=Salary, y=points), method = 'lm', se=FALSE) +
  ylab('Projected Points') +
  xlab('Salary') +
  ggtitle('Who makes it into Optimized Lineups?') +
  scale_x_continuous(labels=scales::dollar)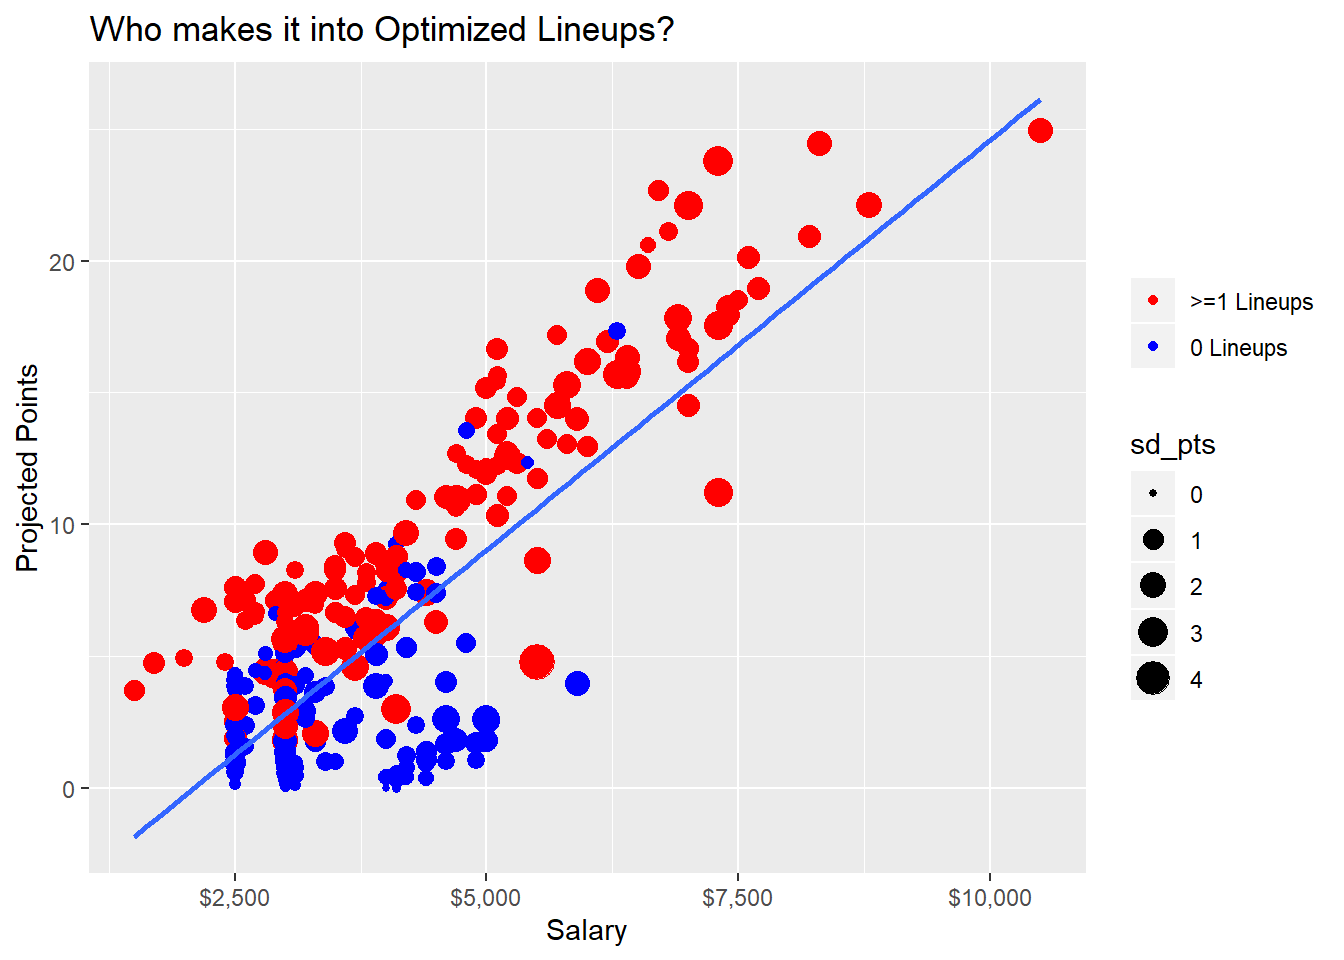
This week, not many players below the line get into lineups, but some above get excluded due to their small uncertainty. Remember, this method takes players who have the potential to blow up rather than players with solid floors.
Flex Configurations
In DFS lineups, you have an extra spot to use on an RB, WR, and TE of your chosing
sim_lu %>%
  group_by(lineup) %>%
  mutate(lineup_pts=sum(pts_pred)) %>%
  group_by(lineup, position) %>%
  mutate(n=n()) %>%
  select(lineup, position, n, lineup_pts) %>%
  distinct() %>%
  spread(key=position, value=n) %>%
  filter(RB>=2, TE>=1, WR>=3) %>%
  mutate(flex=case_when(RB==3 ~ 'RB',
                        TE==2 ~ 'TE',
                        WR==4 ~ 'WR')) %>%
  group_by(flex) %>%
  dplyr::summarize(pts=median(lineup_pts),
                   cases=n()) %>%
  knitr::kable() %>%
kable_styling(full_width = FALSE)| flex | pts | cases |
|---|---|---|
| RB | 153.0444 | 3853 |
| TE | 153.1622 | 3259 |
| WR | 152.9559 | 2888 |
Pretty even flex configurations this week, RBs with a slight lead, TEs second, with WRs third.
Pareto Lineups
lu_df <- sim_lu %>%
  group_by(lineup) %>%
  dplyr::summarize(lineup_pts=sum(pts_pred),
                   lineup_sd=sum(sd_pts)) %>%
  ungroup()

pto <- psel(lu_df, low(lineup_sd) * high(lineup_pts))


ggplot(lu_df, aes(y=lineup_pts, x=lineup_sd)) +
  geom_point() +
  geom_point(data=pto, size=5) +
  ylab('Lineup Points') +
  xlab('Lineup Points St Dev') +
  ggtitle('Lineup Points vs Uncertainty',
          subtitle = 'Pareto Lineups Bolded')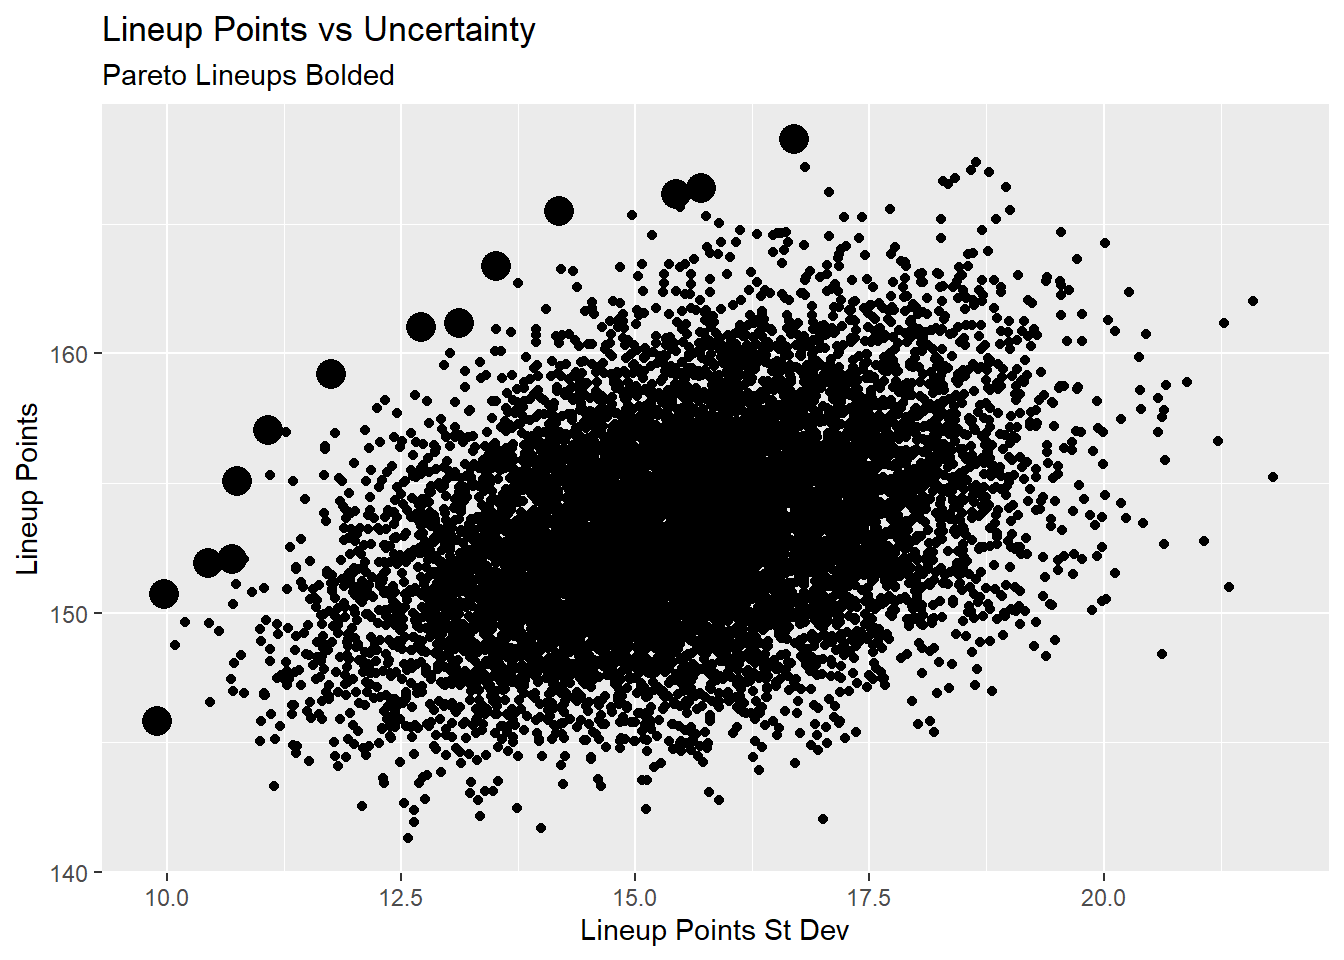
Here’s a look at the pareto lineups.
psel(lu_df, low(lineup_sd) * high(lineup_pts)) %>%
  left_join(sim_lu, by='lineup') %>%
  group_by(lineup) %>%
  arrange(lineup_pts, position, desc(Salary)) %>%
  select(lineup, lineup_pts, lineup_sd, Name, team, position, pts_pred, sd_pts, Salary) %>%
  mutate_at(vars(lineup_pts, lineup_sd, pts_pred, sd_pts), function(x) round(x, 2)) %>%
  knitr::kable() %>%
  kable_styling(fixed_thead = T) %>%
  column_spec(1:3, bold=TRUE) %>%
  collapse_rows(columns = 1:3, valign = 'top') %>%
scroll_box(height = '700px', width = '100%')| lineup | lineup_pts | lineup_sd | Name | team | position | pts_pred | sd_pts | Salary |
|---|---|---|---|---|---|---|---|---|
| 9126 | 145.83 | 9.90 | Chiefs | KCC | DST | 9.29 | 0.90 | 2700 |
| Drew Brees | NOS | QB | 25.09 | 1.13 | 6700 | |||
| David Montgomery | CHI | RB | 15.07 | 0.87 | 5300 | |||
| Devonta Freeman | ATL | RB | 13.75 | 0.94 | 5100 | |||
| Austin Hooper | ATL | TE | 14.77 | 0.85 | 5500 | |||
| Michael Thomas | NOS | WR | 22.32 | 1.69 | 8300 | |||
| Julio Jones | ATL | WR | 19.81 | 0.98 | 7500 | |||
| Jamison Crowder | NYJ | WR | 14.49 | 1.26 | 5000 | |||
| Alex Erickson | CIN | WR | 11.25 | 1.28 | 3900 | |||
| 289 | 150.70 | 9.98 | Bengals | CIN | DST | 5.94 | 1.16 | 1700 |
| Drew Brees | NOS | QB | 24.39 | 1.13 | 6700 | |||
| Alvin Kamara | NOS | RB | 22.94 | 1.34 | 8200 | |||
| Nick Chubb | CLE | RB | 20.40 | 1.10 | 7000 | |||
| Greg Olsen | CAR | TE | 10.81 | 0.68 | 3600 | |||
| Michael Thomas | NOS | WR | 25.68 | 1.69 | 8300 | |||
| Jamison Crowder | NYJ | WR | 13.38 | 1.26 | 5000 | |||
| DeVante Parker | MIA | WR | 13.55 | 0.78 | 4800 | |||
| Tyler Boyd | CIN | WR | 13.60 | 0.84 | 4700 | |||
| 9506 | 151.91 | 10.44 | Cardinals | ARI | DST | 13.27 | 1.99 | 2200 |
| Drew Brees | NOS | QB | 22.95 | 1.13 | 6700 | |||
| Nick Chubb | CLE | RB | 17.33 | 1.10 | 7000 | |||
| David Montgomery | CHI | RB | 15.25 | 0.87 | 5300 | |||
| Mike Gesicki | MIA | TE | 9.60 | 0.67 | 3100 | |||
| Michael Thomas | NOS | WR | 24.12 | 1.69 | 8300 | |||
| Mike Evans | TBB | WR | 21.40 | 1.42 | 7600 | |||
| Sammy Watkins | KCC | WR | 14.02 | 0.72 | 5100 | |||
| Tyler Boyd | CIN | WR | 13.96 | 0.84 | 4700 | |||
| 6293 | 152.09 | 10.70 | Cardinals | ARI | DST | 10.35 | 1.99 | 2200 |
| Drew Brees | NOS | QB | 22.05 | 1.13 | 6700 | |||
| Aaron Jones | GBP | RB | 21.46 | 1.61 | 7400 | |||
| David Montgomery | CHI | RB | 15.88 | 0.87 | 5300 | |||
| Devonta Freeman | ATL | RB | 15.27 | 0.94 | 5100 | |||
| Austin Hooper | ATL | TE | 15.45 | 0.85 | 5500 | |||
| Michael Thomas | NOS | WR | 25.28 | 1.69 | 8300 | |||
| DeVante Parker | MIA | WR | 12.64 | 0.78 | 4800 | |||
| Tyler Boyd | CIN | WR | 13.70 | 0.84 | 4700 | |||
| 1609 | 155.09 | 10.75 | Steelers | PIT | DST | 7.54 | 1.29 | 2600 |
| Drew Brees | NOS | QB | 23.56 | 1.13 | 6700 | |||
| Alvin Kamara | NOS | RB | 24.26 | 1.34 | 8200 | |||
| David Montgomery | CHI | RB | 16.32 | 0.87 | 5300 | |||
| Mike Gesicki | MIA | TE | 8.55 | 0.67 | 3100 | |||
| Michael Thomas | NOS | WR | 25.34 | 1.69 | 8300 | |||
| Mike Evans | TBB | WR | 22.23 | 1.42 | 7600 | |||
| Tyler Boyd | CIN | WR | 14.25 | 0.84 | 4700 | |||
| Demaryius Thomas | NYJ | WR | 13.04 | 1.49 | 3500 | |||
| 2966 | 157.03 | 11.08 | Giants | NYG | DST | 12.95 | 1.80 | 2800 |
| Drew Brees | NOS | QB | 22.88 | 1.13 | 6700 | |||
| Aaron Jones | GBP | RB | 19.94 | 1.61 | 7400 | |||
| Devonta Freeman | ATL | RB | 14.82 | 0.94 | 5100 | |||
| Mike Gesicki | MIA | TE | 7.64 | 0.67 | 3100 | |||
| Michael Thomas | NOS | WR | 29.12 | 1.69 | 8300 | |||
| Mike Evans | TBB | WR | 24.12 | 1.42 | 7600 | |||
| Tyler Boyd | CIN | WR | 12.70 | 0.84 | 4700 | |||
| A.J. Brown | TEN | WR | 12.85 | 0.98 | 4300 | |||
| 3036 | 159.21 | 11.75 | Chiefs | KCC | DST | 9.97 | 0.90 | 2700 |
| Drew Brees | NOS | QB | 23.74 | 1.13 | 6700 | |||
| David Montgomery | CHI | RB | 16.94 | 0.87 | 5300 | |||
| Devonta Freeman | ATL | RB | 14.55 | 0.94 | 5100 | |||
| Travis Kelce | KCC | TE | 21.14 | 1.73 | 6400 | |||
| Rhett Ellison | NYG | TE | 10.60 | 1.47 | 2500 | |||
| Michael Thomas | NOS | WR | 24.82 | 1.69 | 8300 | |||
| Mike Evans | TBB | WR | 22.76 | 1.42 | 7600 | |||
| Christian Kirk | ARI | WR | 14.70 | 1.60 | 5200 | |||
| 1204 | 161.00 | 12.72 | Steelers | PIT | DST | 10.84 | 1.29 | 2600 |
| Lamar Jackson | BAL | QB | 30.46 | 2.99 | 7300 | |||
| David Montgomery | CHI | RB | 15.39 | 0.87 | 5300 | |||
| Damien Williams | KCC | RB | 14.11 | 0.82 | 4900 | |||
| Jack Doyle | IND | TE | 11.19 | 1.17 | 3600 | |||
| Rhett Ellison | NYG | TE | 9.91 | 1.47 | 2500 | |||
| Michael Thomas | NOS | WR | 25.36 | 1.69 | 8300 | |||
| Tyreek Hill | KCC | WR | 21.67 | 1.43 | 7700 | |||
| Julio Jones | ATL | WR | 22.07 | 0.98 | 7500 | |||
| 2595 | 161.18 | 13.12 | Giants | NYG | DST | 11.38 | 1.80 | 2800 |
| Drew Brees | NOS | QB | 25.01 | 1.13 | 6700 | |||
| Le’Veon Bell | NYJ | RB | 21.47 | 1.89 | 6900 | |||
| Kareem Hunt | CLE | RB | 10.62 | 1.91 | 3000 | |||
| Rhett Ellison | NYG | TE | 10.00 | 1.47 | 2500 | |||
| Michael Thomas | NOS | WR | 26.73 | 1.69 | 8300 | |||
| Mike Evans | TBB | WR | 20.84 | 1.42 | 7600 | |||
| Julio Jones | ATL | WR | 20.94 | 0.98 | 7500 | |||
| Tyler Boyd | CIN | WR | 14.19 | 0.84 | 4700 | |||
| 626 | 163.38 | 13.51 | Cardinals | ARI | DST | 12.06 | 1.99 | 2200 |
| Ryan Tannehill | TEN | QB | 19.65 | 1.27 | 5100 | |||
| Saquon Barkley | NYG | RB | 25.83 | 1.98 | 8800 | |||
| Le’Veon Bell | NYJ | RB | 20.76 | 1.89 | 6900 | |||
| Devonta Freeman | ATL | RB | 14.69 | 0.94 | 5100 | |||
| Jack Doyle | IND | TE | 11.51 | 1.17 | 3600 | |||
| Michael Thomas | NOS | WR | 28.86 | 1.69 | 8300 | |||
| Christian Kirk | ARI | WR | 16.33 | 1.60 | 5200 | |||
| A.J. Brown | TEN | WR | 13.69 | 0.98 | 4300 | |||
| 3870 | 165.51 | 14.19 | Giants | NYG | DST | 12.46 | 1.80 | 2800 |
| Drew Brees | NOS | QB | 23.89 | 1.13 | 6700 | |||
| Aaron Jones | GBP | RB | 22.81 | 1.61 | 7400 | |||
| Kareem Hunt | CLE | RB | 10.75 | 1.91 | 3000 | |||
| Travis Kelce | KCC | TE | 21.85 | 1.73 | 6400 | |||
| Mike Gesicki | MIA | TE | 9.46 | 0.67 | 3100 | |||
| Michael Thomas | NOS | WR | 27.53 | 1.69 | 8300 | |||
| Cooper Kupp | LAR | WR | 23.35 | 2.81 | 7300 | |||
| Tyler Boyd | CIN | WR | 13.41 | 0.84 | 4700 | |||
| 7078 | 166.17 | 15.44 | Browns | CLE | DST | 10.27 | 1.34 | 2500 |
| Lamar Jackson | BAL | QB | 27.48 | 2.99 | 7300 | |||
| David Johnson | ARI | RB | 19.95 | 2.13 | 5700 | |||
| David Montgomery | CHI | RB | 17.05 | 0.87 | 5300 | |||
| Travis Kelce | KCC | TE | 19.89 | 1.73 | 6400 | |||
| Mark Andrews | BAL | TE | 16.99 | 2.23 | 5200 | |||
| Michael Thomas | NOS | WR | 27.26 | 1.69 | 8300 | |||
| Tyler Boyd | CIN | WR | 13.13 | 0.84 | 4700 | |||
| Curtis Samuel | CAR | WR | 14.14 | 1.62 | 4600 | |||
| 7519 | 166.39 | 15.70 | Bills | BUF | DST | 9.80 | 1.10 | 2900 |
| Lamar Jackson | BAL | QB | 32.68 | 2.99 | 7300 | |||
| Alvin Kamara | NOS | RB | 22.92 | 1.34 | 8200 | |||
| Tarik Cohen | CHI | RB | 13.55 | 2.09 | 4200 | |||
| Kareem Hunt | CLE | RB | 11.46 | 1.91 | 3000 | |||
| Rhett Ellison | NYG | TE | 10.14 | 1.47 | 2500 | |||
| Michael Thomas | NOS | WR | 27.41 | 1.69 | 8300 | |||
| Tyreek Hill | KCC | WR | 21.27 | 1.43 | 7700 | |||
| Golden Tate | NYG | WR | 17.18 | 1.67 | 5900 | |||
| 8602 | 168.26 | 16.70 | Cardinals | ARI | DST | 10.03 | 1.99 | 2200 |
| Patrick Mahomes | KCC | QB | 27.50 | 2.61 | 7000 | |||
| Jaylen Samuels | PIT | RB | 21.76 | 2.61 | 6300 | |||
| David Montgomery | CHI | RB | 14.89 | 0.87 | 5300 | |||
| Kareem Hunt | CLE | RB | 12.42 | 1.91 | 3000 | |||
| Mark Andrews | BAL | TE | 17.63 | 2.23 | 5200 | |||
| Michael Thomas | NOS | WR | 28.02 | 1.69 | 8300 | |||
| Chris Godwin | TBB | WR | 20.86 | 1.63 | 7400 | |||
| Zach Pascal | IND | WR | 15.14 | 1.17 | 5300 |
Week 10 optimal lineups can be found here
