
Week 11 DraftKings Optimal Lineups
We are BACK with optimal lineups from week 11 simulations! (Better Late than Never!)
Not much commentary this week, we have the sickness roaring through our household, and just had family visiting, so didn’t have much time/energy to make changes. However, I did add some plotly wrappers to some plots, inspired by Jonathan Regenstein’s blog post on IPO exploration
If you want to review the overall code for scraping and optimizing projections, the initial post is here.
Setup
library(data.table)
library(dtplyr)
library(tidyverse)
library(rPref)
library(kableExtra)
library(plotly)
library(scales)
library(labeling)


week <- 11

proj <- readRDS(paste0('week_', week, '_proj.RDS'))

sal <- read_csv(paste0('DKSalaries_wk_', week, '.csv'))
I’ll start with the optimized lineups pulled for the week, with the same details as last time: 10,000 lineups, using the standard deviation of projections, completely individually based (still working on that).
sim_lu <- readRDS(paste0('sim_lineups_week_', week, '.RDS')) %>%
  rename(pts_base=points) %>%
  select(lineup, Name, team, position, pts_base, pts_pred, sd_pts, Salary)

glimpse(sim_lu)
## Observations: 90,000
## Variables: 8
## Groups: Name [153]
## $ lineup <int> 1, 1, 1, 1, 1, 1, 1, 1, 1, 2, 2, 2, 2, 2, 2, 2, 2, 2,...
## $ Name <chr> "Cardinals", "Tyler Kroft", "Leonard Fournette", "Chr...
## $ team <chr> "ARI", "BUF", "JAC", "CAR", "JAC", "TBB", "WAS", "CAR...
## $ position <chr> "DST", "TE", "RB", "RB", "WR", "WR", "WR", "QB", "RB"...
## $ pts_base <dbl> 5.841981, 3.451956, 18.860242, 26.315687, 10.922359, ...
## $ pts_pred <dbl> 7.115542, 9.499117, 24.304505, 30.701401, 14.070445, ...
## $ sd_pts <dbl> 1.4228211, 2.1754744, 1.9781903, 3.2835311, 1.6836537...
## $ Salary <dbl> 1500, 2800, 7900, 10500, 4500, 7300, 3300, 5300, 6900...sim_lu %>%
filter(lineup<=3) %>%
arrange(lineup, position, desc(pts_pred)) %>%
mutate_at(vars(pts_base, pts_pred, sd_pts), function(x) round(x, 2)) %>%
knitr::kable() %>%
kable_styling() %>%
column_spec(1, bold=TRUE) %>%
collapse_rows(columns = 1, valign = 'top') %>%
scroll_box(height = '600px', width = '100%')| lineup | Name | team | position | pts_base | pts_pred | sd_pts | Salary |
|---|---|---|---|---|---|---|---|
| 1 | Cardinals | ARI | DST | 5.84 | 7.12 | 1.42 | 1500 |
| Kyle Allen | CAR | QB | 17.93 | 19.02 | 0.67 | 5300 | |
| Christian McCaffrey | CAR | RB | 26.32 | 30.70 | 3.28 | 10500 | |
| Leonard Fournette | JAC | RB | 18.86 | 24.30 | 1.98 | 7900 | |
| Josh Jacobs | OAK | RB | 17.81 | 20.14 | 2.50 | 6900 | |
| Tyler Kroft | BUF | TE | 3.45 | 9.50 | 2.18 | 2800 | |
| Chris Godwin | TBB | WR | 17.01 | 19.92 | 1.99 | 7300 | |
| Dede Westbrook | JAC | WR | 10.92 | 14.07 | 1.68 | 4500 | |
| Trey Quinn | WAS | WR | 6.93 | 9.11 | 1.41 | 3300 | |
| 2 | Cardinals | ARI | DST | 5.84 | 8.91 | 1.42 | 1500 |
| Lamar Jackson | BAL | QB | 24.49 | 24.74 | 1.58 | 7700 | |
| Alvin Kamara | NOS | RB | 20.48 | 21.58 | 1.11 | 7400 | |
| Raheem Mostert | SFO | RB | 7.95 | 10.98 | 2.27 | 3400 | |
| Darren Waller | OAK | TE | 14.66 | 17.84 | 2.73 | 5500 | |
| Julio Jones | ATL | WR | 19.91 | 21.34 | 1.80 | 7500 | |
| Chris Godwin | TBB | WR | 17.01 | 20.89 | 1.99 | 7300 | |
| Curtis Samuel | CAR | WR | 12.57 | 17.13 | 1.24 | 5300 | |
| Deebo Samuel | SFO | WR | 11.25 | 13.57 | 2.25 | 4000 | |
| 3 | Saints | NOS | DST | 8.52 | 12.42 | 1.80 | 2900 |
| Kyle Allen | CAR | QB | 17.93 | 19.01 | 0.67 | 5300 | |
| Dalvin Cook | MIN | RB | 22.93 | 27.37 | 2.14 | 8900 | |
| Josh Jacobs | OAK | RB | 17.81 | 19.03 | 2.50 | 6900 | |
| Brian Hill | ATL | RB | 13.69 | 15.22 | 2.42 | 4800 | |
| Darren Waller | OAK | TE | 14.66 | 15.78 | 2.73 | 5500 | |
| John Brown | BUF | WR | 14.54 | 18.37 | 2.07 | 6400 | |
| Deebo Samuel | SFO | WR | 11.25 | 16.36 | 2.25 | 4000 | |
| Tyler Boyd | CIN | WR | 14.25 | 13.57 | 0.50 | 5200 |
Who is in Optimal Lineups?
ggplotly(
  sim_lu %>%
  group_by(Name, position, Salary) %>%
  dplyr::summarize(lu=n_distinct(lineup)) %>%
  ungroup() %>%
  group_by(position) %>%
  top_n(10, lu) %>%
  ungroup() %>%
  arrange(position, desc(lu)) %>%
  mutate(Name=factor(Name),
         Name=fct_reorder(Name, lu)) %>%
  ggplot(aes(x=Name, y=round(lu/1000, 2), fill=Salary, text=paste(Name, 'in', lu, 'lineups with', dollar(Salary), 'salary'))) +
  geom_bar(stat='identity') +
  facet_wrap(~position, ncol = 3, scales='free_y') +
  coord_flip() +
  #scale_y_continuous(labels = scales::comma) +
  scale_fill_viridis_c() +
  xlab('') +
  ylab('Lineups (Thousands)') +
  ggtitle('Top 10 Players Present by Position')
) %>% ggplotly(tooltip = 'text')
(Still new to Plotly, sorry about the weird facet widths and funky labels, but since I’m short on time, I thought the benefit of interactivity was worth the funky formatting)
Some of my observations:
A top-heavy week at QB, we’re still riding Lamar Jackson and Deshaun Watson, with Dak Prescott thrown in there
Alvin Kamar is the top RB represented, with Brian Hill and Miles Sanders being the value plays.
They really upped Michael Thomas’ salary, so we won’t be riding him as hard this week. Deebo Samuel is the most represented WR this week, due to low salary. Hopefully he fixes the drops this week
Second week in a row with a heavy TE favorite, this week being Darren Waller. Eric Ebron is the second most represented.
Cardinals, Saints, and Lions D Most Represented
Who is getting placed in Lineups?
DraftKings provides scoring for 379 players this week, but only 153 make it into optimized lineups. Why is that? To determine, I’ll plot projected points vs salary, colored by whether or not they make it into optimized lineups, and sized by their projection standard deviation
plyr_lu <- sim_lu %>%
  group_by(Name, position) %>%
  dplyr::summarize(lu=n_distinct(lineup)) %>%
  ungroup()

ggplotly(
proj %>%
  dplyr::filter(avg_type=='weighted') %>%
  mutate(Name = ifelse(pos=="DST", last_name, paste(first_name, last_name))) %>%
  inner_join(sal, by=c("Name")) %>%
  select(Name, team, position, points, Salary, sd_pts) %>%
  left_join(plyr_lu, by='Name') %>%
  replace_na(list(lu=0)) %>%
  mutate(lu_bin=ifelse(lu==0, '0 Lineups', '>=1 Lineups'),
         lu_5=cut(lu,5, labels = FALSE)) %>%
  ggplot(aes(x=Salary, y=points, color=lu_bin, size=sd_pts, text=Name)) +
  geom_point() +
  theme_minimal() +
  scale_color_manual(values = c('red', 'blue'), name="") +
  geom_smooth(inherit.aes = FALSE, aes(x=Salary, y=points), method = 'lm') +
  ylab('Projected Points') +
  xlab('Salary') +
  ggtitle('Who makes it into Optimized Lineups?') +
  scale_x_continuous(labels=scales::dollar))
This week, not many players below the line get into lineups, but some above get excluded due to their small uncertainty. Remember, this method takes players who have the potential to blow up rather than players with solid floors.
Flex Configurations
In DFS lineups, you have an extra spot to use on an RB, WR, and TE of your chosing
sim_lu %>%
  group_by(lineup) %>%
  mutate(lineup_pts=sum(pts_pred)) %>%
  group_by(lineup, position) %>%
  mutate(n=n()) %>%
  select(lineup, position, n, lineup_pts) %>%
  distinct() %>%
  spread(key=position, value=n) %>%
  filter(RB>=2, TE>=1, WR>=3) %>%
  mutate(flex=case_when(RB==3 ~ 'RB',
                        TE==2 ~ 'TE',
                        WR==4 ~ 'WR')) %>%
  group_by(flex) %>%
  dplyr::summarize(pts=median(lineup_pts),
                   cases=n()) %>%
  knitr::kable() %>%
kable_styling(full_width = FALSE)| flex | pts | cases |
|---|---|---|
| RB | 152.5108 | 6622 |
| TE | 152.0526 | 1839 |
| WR | 151.8612 | 1539 |
HEAVY RB week this week, with more than 60% of Flex Spots being taken by RBs
Pareto Lineups
lu_df <- sim_lu %>%
  group_by(lineup) %>%
  dplyr::summarize(lineup_pts=sum(pts_pred),
                   lineup_sd=sum(sd_pts)) %>%
  ungroup()

pto <- psel(lu_df, low(lineup_sd) * high(lineup_pts))


ggplot(lu_df, aes(y=lineup_pts, x=lineup_sd)) +
  geom_point() +
  geom_point(data=pto, size=5) +
  ylab('Lineup Points') +
  xlab('Lineup Points St Dev') +
  ggtitle('Lineup Points vs Uncertainty',
          subtitle = 'Pareto Lineups Bolded')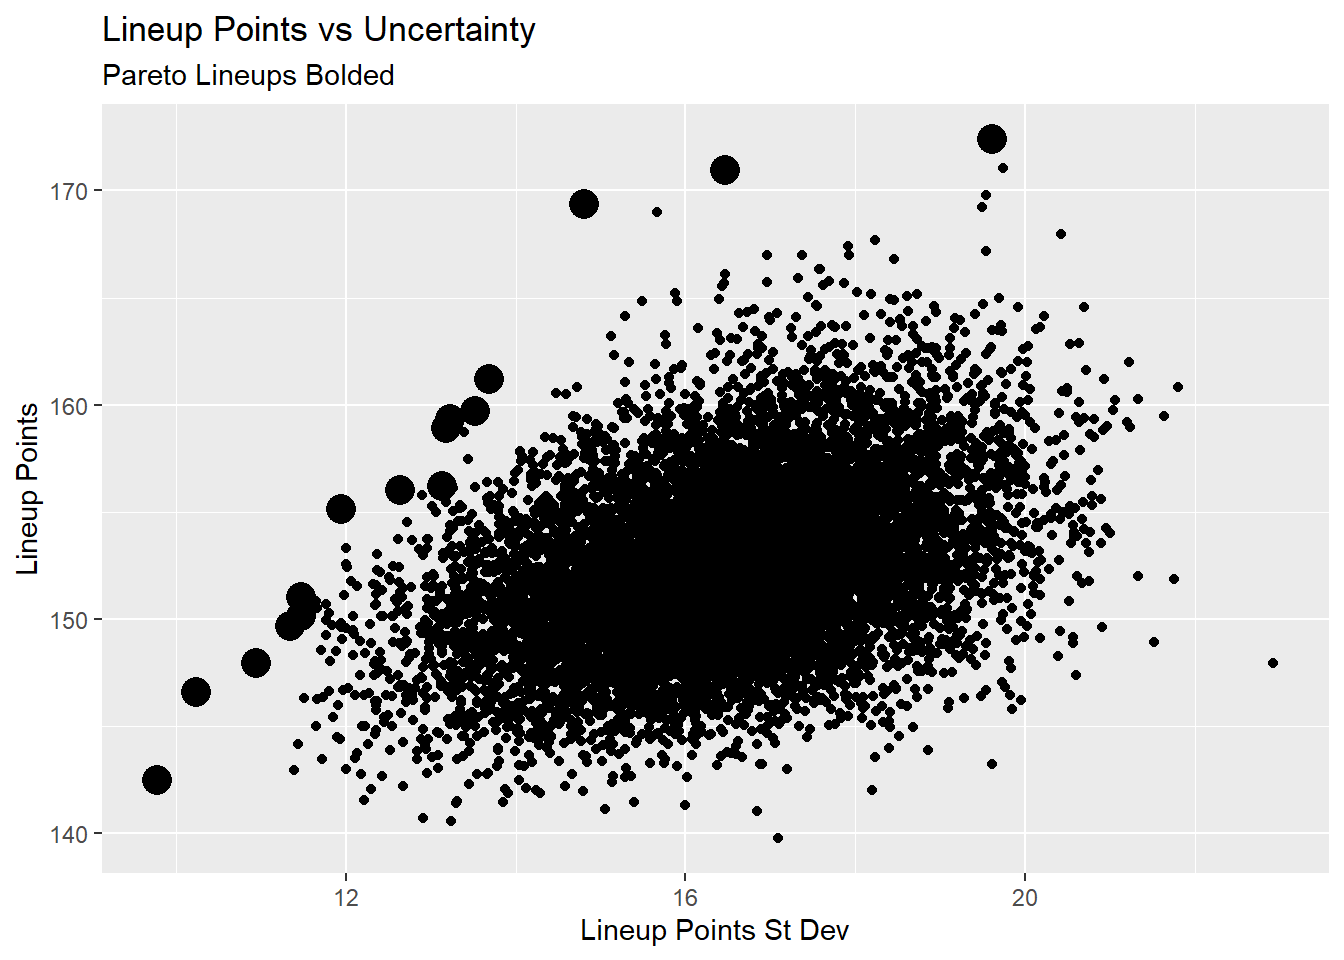
Here’s a look at the pareto lineups.
psel(lu_df, low(lineup_sd) * high(lineup_pts)) %>%
  left_join(sim_lu, by='lineup') %>%
  group_by(lineup) %>%
  arrange(lineup_pts, position, desc(Salary)) %>%
  select(lineup, lineup_pts, lineup_sd, Name, team, position, pts_pred, sd_pts, Salary) %>%
  mutate_at(vars(lineup_pts, lineup_sd, pts_pred, sd_pts), function(x) round(x, 2)) %>%
  knitr::kable() %>%
  kable_styling(fixed_thead = T) %>%
  column_spec(1:3, bold=TRUE) %>%
  collapse_rows(columns = 1:3, valign = 'top') %>%
scroll_box(height = '700px', width = '100%')| lineup | lineup_pts | lineup_sd | Name | team | position | pts_pred | sd_pts | Salary |
|---|---|---|---|---|---|---|---|---|
| 7674 | 142.50 | 9.78 | Dolphins | MIA | DST | 7.10 | 1.01 | 2500 |
| Lamar Jackson | BAL | QB | 26.41 | 1.58 | 7700 | |||
| Leonard Fournette | JAC | RB | 21.32 | 1.98 | 7900 | |||
| Alvin Kamara | NOS | RB | 21.47 | 1.11 | 7400 | |||
| Kenyan Drake | ARI | RB | 15.47 | 1.47 | 5400 | |||
| Dallas Goedert | PHI | TE | 9.35 | 0.97 | 3200 | |||
| Courtland Sutton | DEN | WR | 15.58 | 0.82 | 6000 | |||
| Tyler Boyd | CIN | WR | 13.46 | 0.50 | 5200 | |||
| DeVante Parker | MIA | WR | 12.34 | 0.35 | 4700 | |||
| 7722 | 146.57 | 10.24 | Cardinals | ARI | DST | 5.81 | 1.42 | 1500 |
| Dak Prescott | DAL | QB | 22.59 | 0.55 | 6700 | |||
| Alvin Kamara | NOS | RB | 21.13 | 1.11 | 7400 | |||
| Duke Johnson | HOU | RB | 11.27 | 1.19 | 4000 | |||
| Zach Ertz | PHI | TE | 13.80 | 0.67 | 5000 | |||
| Julio Jones | ATL | WR | 22.72 | 1.80 | 7500 | |||
| Mike Evans | TBB | WR | 20.86 | 1.75 | 7400 | |||
| Curtis Samuel | CAR | WR | 14.27 | 1.24 | 5300 | |||
| Tyler Boyd | CIN | WR | 14.11 | 0.50 | 5200 | |||
| 7776 | 147.94 | 10.94 | Cardinals | ARI | DST | 6.63 | 1.42 | 1500 |
| Dak Prescott | DAL | QB | 22.36 | 0.55 | 6700 | |||
| Dalvin Cook | MIN | RB | 26.74 | 2.14 | 8900 | |||
| Alvin Kamara | NOS | RB | 21.34 | 1.11 | 7400 | |||
| Tyler Eifert | CIN | TE | 8.60 | 0.75 | 3200 | |||
| Michael Thomas | NOS | WR | 27.34 | 1.80 | 9900 | |||
| Tyler Boyd | CIN | WR | 14.32 | 0.50 | 5200 | |||
| Danny Amendola | DET | WR | 10.86 | 1.28 | 4200 | |||
| Kendrick Bourne | SFO | WR | 9.75 | 1.39 | 3000 | |||
| 5738 | 149.65 | 11.35 | Lions | DET | DST | 6.93 | 1.18 | 1800 |
| Dak Prescott | DAL | QB | 22.31 | 0.55 | 6700 | |||
| Alvin Kamara | NOS | RB | 20.85 | 1.11 | 7400 | |||
| Miles Sanders | PHI | RB | 14.16 | 2.58 | 4100 | |||
| Greg Olsen | CAR | TE | 12.10 | 1.07 | 3900 | |||
| Julio Jones | ATL | WR | 22.83 | 1.80 | 7500 | |||
| Mike Evans | TBB | WR | 20.21 | 1.75 | 7400 | |||
| Courtland Sutton | DEN | WR | 16.11 | 0.82 | 6000 | |||
| Tyler Boyd | CIN | WR | 14.17 | 0.50 | 5200 | |||
| 7422 | 150.16 | 11.47 | Cardinals | ARI | DST | 7.17 | 1.42 | 1500 |
| Lamar Jackson | BAL | QB | 25.72 | 1.58 | 7700 | |||
| Alvin Kamara | NOS | RB | 19.99 | 1.11 | 7400 | |||
| James White | NEP | RB | 15.45 | 0.96 | 5400 | |||
| Zach Ertz | PHI | TE | 13.62 | 0.67 | 5000 | |||
| Julio Jones | ATL | WR | 23.84 | 1.80 | 7500 | |||
| Christian Kirk | ARI | WR | 15.06 | 0.90 | 5700 | |||
| Tyler Boyd | CIN | WR | 14.78 | 0.50 | 5200 | |||
| Kenny Stills | HOU | WR | 14.53 | 2.53 | 4600 | |||
| 2258 | 151.03 | 11.48 | Cardinals | ARI | DST | 6.32 | 1.42 | 1500 |
| Dak Prescott | DAL | QB | 22.96 | 0.55 | 6700 | |||
| Dalvin Cook | MIN | RB | 26.62 | 2.14 | 8900 | |||
| Alvin Kamara | NOS | RB | 21.44 | 1.11 | 7400 | |||
| Greg Olsen | CAR | TE | 12.93 | 1.07 | 3900 | |||
| Eric Ebron | IND | TE | 11.73 | 1.64 | 3600 | |||
| Julio Jones | ATL | WR | 20.68 | 1.80 | 7500 | |||
| Curtis Samuel | CAR | WR | 14.22 | 1.24 | 5300 | |||
| Tyler Boyd | CIN | WR | 14.12 | 0.50 | 5200 | |||
| 7077 | 155.14 | 11.94 | Redskins | WAS | DST | 10.22 | 1.20 | 2800 |
| Dak Prescott | DAL | QB | 22.65 | 0.55 | 6700 | |||
| Dalvin Cook | MIN | RB | 28.66 | 2.14 | 8900 | |||
| Alvin Kamara | NOS | RB | 22.53 | 1.11 | 7400 | |||
| Brian Hill | ATL | RB | 18.49 | 2.42 | 4800 | |||
| O.J. Howard | TBB | TE | 9.97 | 0.97 | 3600 | |||
| DeAndre Hopkins | HOU | WR | 22.55 | 1.81 | 8100 | |||
| DeVante Parker | MIA | WR | 12.33 | 0.35 | 4700 | |||
| Kendrick Bourne | SFO | WR | 7.75 | 1.39 | 3000 | |||
| 5943 | 156.00 | 12.64 | Broncos | DEN | DST | 6.53 | 0.73 | 2400 |
| Dak Prescott | DAL | QB | 22.68 | 0.55 | 6700 | |||
| Dalvin Cook | MIN | RB | 26.09 | 2.14 | 8900 | |||
| Brian Hill | ATL | RB | 17.04 | 2.42 | 4800 | |||
| Miles Sanders | PHI | RB | 16.75 | 2.58 | 4100 | |||
| Zach Ertz | PHI | TE | 13.96 | 0.67 | 5000 | |||
| Julio Jones | ATL | WR | 22.97 | 1.80 | 7500 | |||
| Curtis Samuel | CAR | WR | 15.27 | 1.24 | 5300 | |||
| Tyler Boyd | CIN | WR | 14.72 | 0.50 | 5200 | |||
| 3116 | 156.18 | 13.14 | Cardinals | ARI | DST | 8.22 | 1.42 | 1500 |
| Deshaun Watson | HOU | QB | 24.01 | 1.74 | 6800 | |||
| Dalvin Cook | MIN | RB | 30.04 | 2.14 | 8900 | |||
| Alvin Kamara | NOS | RB | 20.77 | 1.11 | 7400 | |||
| Brian Hill | ATL | RB | 13.92 | 2.42 | 4800 | |||
| Zach Ertz | PHI | TE | 14.54 | 0.67 | 5000 | |||
| Mike Evans | TBB | WR | 20.62 | 1.75 | 7400 | |||
| Tyler Boyd | CIN | WR | 14.85 | 0.50 | 5200 | |||
| Kendrick Bourne | SFO | WR | 9.20 | 1.39 | 3000 | |||
| 7102 | 158.92 | 13.19 | Lions | DET | DST | 6.16 | 1.18 | 1800 |
| Dak Prescott | DAL | QB | 22.81 | 0.55 | 6700 | |||
| Dalvin Cook | MIN | RB | 26.69 | 2.14 | 8900 | |||
| Alvin Kamara | NOS | RB | 22.69 | 1.11 | 7400 | |||
| Miles Sanders | PHI | RB | 18.32 | 2.58 | 4100 | |||
| Eric Ebron | IND | TE | 12.83 | 1.64 | 3600 | |||
| Julio Jones | ATL | WR | 21.25 | 1.80 | 7500 | |||
| Tyler Boyd | CIN | WR | 14.78 | 0.50 | 5200 | |||
| Dede Westbrook | JAC | WR | 13.40 | 1.68 | 4500 | |||
| 5223 | 159.34 | 13.23 | Cardinals | ARI | DST | 6.63 | 1.42 | 1500 |
| Dak Prescott | DAL | QB | 23.06 | 0.55 | 6700 | |||
| Alvin Kamara | NOS | RB | 23.88 | 1.11 | 7400 | |||
| Josh Jacobs | OAK | RB | 21.25 | 2.50 | 6900 | |||
| Brian Hill | ATL | RB | 19.16 | 2.42 | 4800 | |||
| Zach Ertz | PHI | TE | 13.48 | 0.67 | 5000 | |||
| DeAndre Hopkins | HOU | WR | 20.87 | 1.81 | 8100 | |||
| Tyler Boyd | CIN | WR | 14.29 | 0.50 | 5200 | |||
| Deebo Samuel | SFO | WR | 16.71 | 2.25 | 4000 | |||
| 9981 | 159.72 | 13.52 | Cardinals | ARI | DST | 8.10 | 1.42 | 1500 |
| Dak Prescott | DAL | QB | 22.40 | 0.55 | 6700 | |||
| Alvin Kamara | NOS | RB | 22.19 | 1.11 | 7400 | |||
| Tevin Coleman | SFO | RB | 17.04 | 2.47 | 6100 | |||
| Darren Waller | OAK | TE | 20.06 | 2.73 | 5500 | |||
| Julio Jones | ATL | WR | 24.11 | 1.80 | 7500 | |||
| Calvin Ridley | ATL | WR | 16.61 | 1.26 | 5500 | |||
| Tyler Boyd | CIN | WR | 14.99 | 0.50 | 5200 | |||
| Dede Westbrook | JAC | WR | 14.22 | 1.68 | 4500 | |||
| 9574 | 161.18 | 13.69 | Cardinals | ARI | DST | 8.19 | 1.42 | 1500 |
| Dak Prescott | DAL | QB | 22.66 | 0.55 | 6700 | |||
| Alvin Kamara | NOS | RB | 22.18 | 1.11 | 7400 | |||
| Josh Jacobs | OAK | RB | 23.17 | 2.50 | 6900 | |||
| Zach Ertz | PHI | TE | 13.80 | 0.67 | 5000 | |||
| Eric Ebron | IND | TE | 11.60 | 1.64 | 3600 | |||
| Julio Jones | ATL | WR | 21.46 | 1.80 | 7500 | |||
| Mike Evans | TBB | WR | 21.81 | 1.75 | 7400 | |||
| Deebo Samuel | SFO | WR | 16.30 | 2.25 | 4000 | |||
| 3623 | 169.36 | 14.81 | Saints | NOS | DST | 12.00 | 1.80 | 2900 |
| Kyle Allen | CAR | QB | 18.43 | 0.67 | 5300 | |||
| Dalvin Cook | MIN | RB | 28.92 | 2.14 | 8900 | |||
| Alvin Kamara | NOS | RB | 22.88 | 1.11 | 7400 | |||
| Miles Sanders | PHI | RB | 17.92 | 2.58 | 4100 | |||
| Eric Ebron | IND | TE | 11.22 | 1.64 | 3600 | |||
| Julio Jones | ATL | WR | 22.15 | 1.80 | 7500 | |||
| Courtland Sutton | DEN | WR | 16.84 | 0.82 | 6000 | |||
| Deebo Samuel | SFO | WR | 19.00 | 2.25 | 4000 | |||
| 3825 | 170.96 | 16.47 | Saints | NOS | DST | 12.05 | 1.80 | 2900 |
| Dak Prescott | DAL | QB | 23.40 | 0.55 | 6700 | |||
| Josh Jacobs | OAK | RB | 26.01 | 2.50 | 6900 | |||
| Brian Hill | ATL | RB | 18.70 | 2.42 | 4800 | |||
| Mark Andrews | BAL | TE | 18.37 | 1.83 | 6100 | |||
| Eric Ebron | IND | TE | 13.84 | 1.64 | 3600 | |||
| Michael Thomas | NOS | WR | 28.60 | 1.80 | 9900 | |||
| Dede Westbrook | JAC | WR | 14.53 | 1.68 | 4500 | |||
| Deebo Samuel | SFO | WR | 15.46 | 2.25 | 4000 | |||
| 9792 | 172.38 | 19.61 | Saints | NOS | DST | 11.71 | 1.80 | 2900 |
| Lamar Jackson | BAL | QB | 26.02 | 1.58 | 7700 | |||
| Le’Veon Bell | NYJ | RB | 23.41 | 2.27 | 7200 | |||
| Josh Jacobs | OAK | RB | 23.08 | 2.50 | 6900 | |||
| Brian Hill | ATL | RB | 18.47 | 2.42 | 4800 | |||
| Darren Waller | OAK | TE | 24.38 | 2.73 | 5500 | |||
| Amari Cooper | DAL | WR | 23.06 | 2.68 | 7700 | |||
| Deebo Samuel | SFO | WR | 14.16 | 2.25 | 4000 | |||
| Kendrick Bourne | SFO | WR | 8.09 | 1.39 | 3000 |
Week 11 optimal lineups can be found here
